EXAMPLE 15Constructing a binomial probability distribution

A recent study reported that about 40% of online dating survey respondents are “hoping to start a long-term relationship” (LTR).2 Consider the experiment of choosing three online daters at random, and let
so that a success is defined as choosing someone hoping to start a long-term relationship.
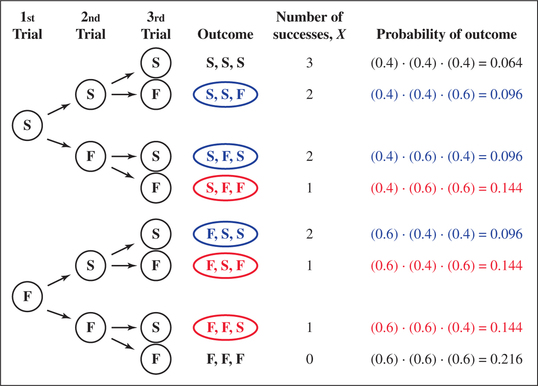
- Construct a tree diagram for this experiment.
- Suppose that we are interested in finding the probability that exactly two of the three online daters would be LTRers, . In the tree diagram, highlight in blue the outcomes where exactly two of the three online daters are LTRers. Find the probability for each outcome, and use these to find .
- Suppose that we are interested in finding . In the tree diagram, highlight in red the outcomes where exactly one of the three online daters is an LTRer. Find the probability for each outcome, and use these to find .
Solution
- Figure 7 shows the tree diagram for this experiment.
As we can see from Figure 7, there are different ways that exactly two of the three online daters could be LTRers (highlighted in blue).
 Figure 6.9: FIGURE 7 Tree diagram and binomial probabilities.
330
For each of these three outcomes, the probability that is .
- The outcome (second row in Figure 7) has probability .
- The outcome has probability .
- The outcome has probability .
Note that each of these products equals , with having exponent , and () having exponent . Thus,
Similarly, suppose that we are interested in whether exactly one of the three online daters is an LTRer. Then, Figure 7 shows us, highlighted in red, that there are different ways this could happen. Each of these outcomes has probability , where has exponent , and has exponent . Thus,
We can generalize these procedures and use the binomial probability distribution formula to find probabilities for the number of successes for any binomial experiment.
Remember: