EXAMPLE 20The binomial mode: the most likely outcome of a binomial experiment
Example 5 (page 314) shows how to construct a probability distribution graph.
Sixty percent of American adults use their cell phones to access the Internet, according to a 2013 report by the Pew Research Center. Suppose we take a random sample of American adults.
- Calculate the mean number of American adults who use their cell phones to access the Internet.
- Use the binomial table to construct a probability distribution graph of the random variable X = the number of Americans who use their cell phones to access the Internet.
- Use the binomial table or the probability distribution graph to find the most likely number of American adults who use their cell phones to access the Internet. Note that this represents the mode of the distribution.
Solution
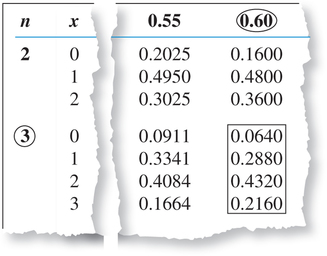
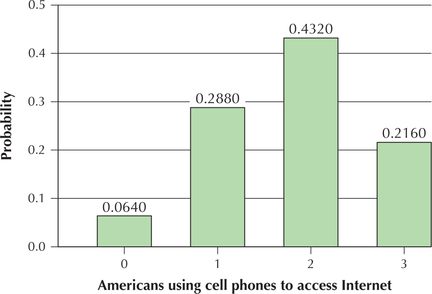
- Figure 14 is an excerpt from the binomial table, highlighting the probabilities for , for and . We use these probabilities to construct the probability distribution graph shown in Figure 15.
336
 Figure 6.16: FIGURE 14 Probabilities for .
 Figure 6.17: FIGURE 15 Probability distribution graph of .
 - The most likely number of Americans using their cell phones to access the Internet is associated with the largest probability in the boxed section of Figure 14, 0.4320, which is . Note from Figure 15 that has the tallest bar of probability. Thus, is the most likely number of American adults using their cell phones to access the Internet. We say that is the mode of the distribution of .
NOW YOU CAN DO
Exercises 53–56.