EXAMPLE 25Uniform probability distribution
Using the uniform probability distribution in Figure 20, calculate the probability that you will wait the following amount of time for the campus shuttle bus:
- Between 2 and 4 minutes
- More than 6 minutes
- Exactly 8 minutes
Solution
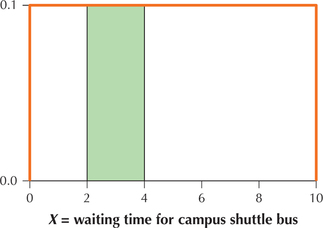
We are interested in the interval between and minutes. The area above this interval forms a rectangle, shown in Figure 21. The area of this green rectangle represents the probability that is between 2 and 4 minutes. The base of the rectangle equals . The height of the rectangle equals 0.1, so we find that the area of this rectangle is
Because area represents probability, we conclude that the probability is 0.2 that you will wait between 2 and 4 minutes for the campus shuttle bus.
351
 Figure 6.23: FIGURE 21 Probability that is between 2 and 4 equals the area of the green rectangle.
- The assumption that the distribution follows a uniform distribution, with waiting times ranging from minutes to minutes, means that the maximum waiting time is 10 minutes. Thus, we are interested in the interval between and . The base of this rectangle equals . Multiplied by the height of the rectangle, 0.1, the resulting . Because area represents probability, this means that the probability we will wait between 6 and 10 minutes equals 0.4.
- Here, we are not given an interval, only a single point, exactly 8 minutes. We can express this as the “interval” from 8 to 8, so that both and . Thus, the width of this “interval” is . Multiplied by the height of the rectangle, 0.1, gives us an area of . Probability equals area, so the probability that we will wait exactly 8 minutes (and not 7.99999 minutes or 8.000001 minutes) is zero. This is an example of our earlier discussion where we learned that, for continuous distributions, the probability that X exactly equals some particular value is always zero.
NOW YOU CAN DO
Exercises 11–20.