EXAMPLE 31Using technology to find the area under a standard normal curve
In Example 28, we found the area under the standard normal curve to the left of to be 0.7157. Confirm this result using technology.
Solution
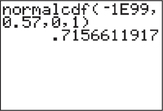
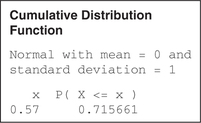
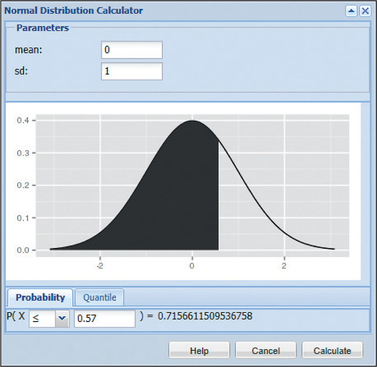
We follow the instructions in the Step-by-Step Technology Guide at the end of Section 6.5 (page 380). Figures 33, 34, 35, and 36 show the results from TI-83/84, Excel, Minitab, and CrunchIt!, respectively.
The word “cumulative” in the Minitab output means “less than or equal to.” Each of these results provides the area under the standard normal curve for values of that are less than or equal to 0.57. Each technology rounds to a different number of decimal places.


 The Normal Density Curve applet allows you to find areas associated with various values of
359
