EXAMPLE 39Finding the probability that lies between two given values
 SAT Scores and AP Exam Scores
Continuing the Math SAT score problem, what percentage of students score between 215 and 595?
 The Normal Density Curve applet allows you to find areas associated with various values of any normal random variable.
Solution
Step 1 Determine , , and .
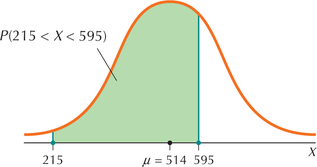
We have already seen that has mean and standard deviation . Once again, draw a graph of the distribution of scores , with the mean 514 in the middle, the score 215 to the left of the mean, and the score 595 to the right of the mean, as in Figure 50.
Step 2 Standardize.
This is a “between” example, where two values of are given, and we are asked to find the area between them. In this case, just standardize both of these values of to get a -value for each:
 Figure 6.52: FIGURE 50 Graph of percentage of students scoring between 215 and 595 on the Math SAT.
Step 3 Draw the standard normal curve.
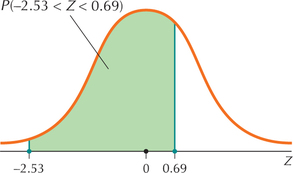
Draw a graph of , shading the area between and , as shown in Figure 51. Again, the key is that the area between and is exactly the same as the area between and .
Step 4 Find area under the standard normal curve.
Figure 51 is a Case 3 problem from Table 8 (page 355). Find the area to the left of 0.69, which is 0.7549, and the area to the left of −2.53, which is 0.0057. Subtracting the smaller from the larger gives us
Thus, the percentage of Math SAT scores that are between 215 and 595 is 74.92%.
 Figure 6.53: FIGURE 51 Graph of percentage of - values between −2.53 and 0.69.
NOW YOU CAN DO
Exercises 10–14.