EXAMPLE 45Performing the normal approximation to the binomial probability distribution
For a group of preschool children with the probability of lack of immunization , perform the following approximations:
- Approximate the probability that there are, at most, 12 children without immunizations.
- Approximate the probability that there are more than 12 children without immunizations.
388
Solution
Once again, we have a binomial experiment with and .
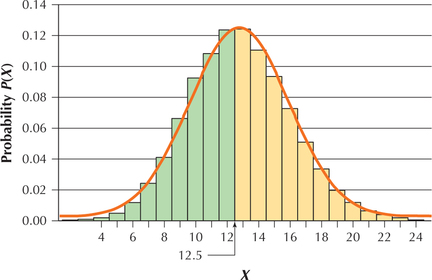
“At most” 12 children means 12 or fewer children. That is, and and , and so on; that is, . In this case, we see that is included in the probability we seek, as shown in Figure 74. From Table 9, we see that is of the form . Thus, our continuity correction takes the form , where we add 0.5 to 12, so that
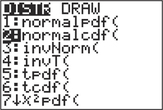
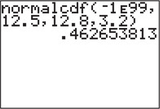
Recall that and . We use the TI-83/84, as shown in Figures 75 and 76, and find that the probability that, at most, 12 children lack immunizations is .
 Figure 6.76: FIGURE 74 Approximates a binomial probability with a normal probability.
 Figure 6.77: FIGURE 75 TI-83/84.
 Figure 6.78: FIGURE 76 TI-83/84 results.
“More than” 12 children means and , and so on. In other words, is not included. That is, we want . From Table 9, we see that is of the form . Thus, our continuity correction takes the form , where we add 0.5 to 12, so that
The desired area is the complement of the green area in Figure 74, so we can find the answer like this:
The probability that more than 12 preschool children will not have the required immunizations is 0.5373.
 The Normal Approximation to the Binomial Distributions applet allows you to choose your own values of and and see how changes in these values affect the normal approximation to the binomial distribution.
NOW YOU CAN DO
Exercises 9–24.