EXAMPLE 5Discrete probability distribution as a graph
The number of points a soccer team gets for a game is a random variable because it is not certain, before the game, how many points the team will get.

In Major League Soccer (MLS), teams are awarded 3 points in the standings for a win, 1 point for a tie, and 0 points for a loss. In the 34-game 2013 MLS season, the New York Red Bulls had 17 wins, 9 losses, and 8 ties.
- Construct a probability distribution table of the number of points per game, based on the team's performance during the 2013 MLS season.
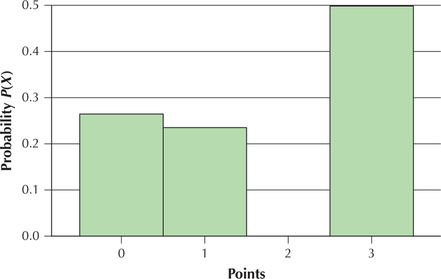
- Construct a probability distribution graph of the number of points per game.
Solution
The probabilities in Table 2 were assigned to the random variable using the relative frequency (empirical) method.
- Let . Then the probability distribution table is given in Table 2.Table 6.7: Table 2Probability distribution table of points awarded for New York Red Bulls
0 1 3 - The probability distribution graph is given in Figure 2.
- The horizontal axis is the usual x axis (the number line), and it shows all the possible values that the random variable can take, such as . The horizontal axis gives the same information as the top row of the table.
- The vertical axis represents probability, and is the information in the bottom row in the table. A vertical bar is drawn at each value of , with the height representing the probability of that value of . For example, the bar of probability at goes up to 0.26 and represents the probability that the New York Red Bulls will lose a game.
 Figure 6.3: FIGURE 2 Probability distribution graph of points awarded for New York Red Bulls.
Given a graph of a probability distribution, you should know how to construct the probability distribution table, and vice versa.
NOW YOU CAN DO
Exercises 17b–24b.