EXAMPLE 8Mean as balance point of the distribution
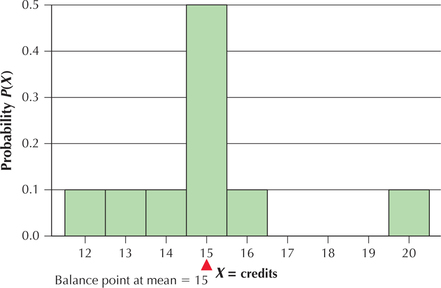
Graph the probability distribution of the random variable , and insert a pivot (a balance point) at the value of the mean, .
Solution
The probability distribution graph of is given in Figure 3. Note that the distribution is balanced at the point .
318

Figure 6.4: FIGURE 3 Probability distribution graph balances at .