For Exercises 17–24, use the given information to do the following for the indicated random variable :
- Construct a probability distribution table.
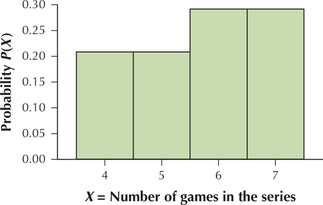
- Construct a probability distribution graph.
Question 6.21
stanleycup
21. The National Hockey League championship is decided by a best-of-seven playoff called the Stanley Cup Finals. The following table shows the possible values of , and the frequency of each value of , for the Stanley Cup Finals between 1990 and 2014.
| Frequency | |
|---|---|
| 4 | 5 |
| 5 | 5 |
| 6 | 7 |
| 7 | 7 |
6.1.21
(a)
| 4 | 0.2083 |
| 5 | 0.2083 |
| 6 | 0.2917 |
| 7 | 0.2917 |
| Total | 1.0000 |
(b)
