Question 6.235
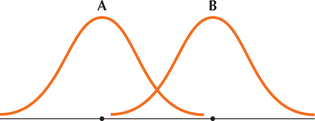
21. The two normal distributions in the accompanying figure have the same standard deviation of 5 but different means. Which normal distribution has mean 10 and which has mean 25? Explain how you know this.

6.4.21
A has mean 10; B has mean 25. The peak of a normal curve is at the mean; from the graphs we see that the mean of A is less than the mean of B.