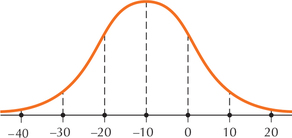
For Exercises 23–30, use the graph of the normal distribution to determine the mean and standard deviation. (Hint: The distance between dotted lines in the figures represents 1 standard deviation.)
Question 6.239
25.

6.4.25
,
For Exercises 23–30, use the graph of the normal distribution to determine the mean and standard deviation. (Hint: The distance between dotted lines in the figures represents 1 standard deviation.)
25.

6.4.25
,