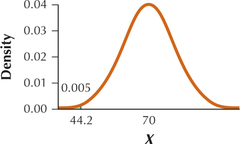
For Exercises 15–26, assume that the random variable is normally distributed with mean and standard deviation . Draw a graph of the normal curve with the desired probability and value of indicated. Find the indicated values of using the formula .
Question 6.366
21. The 0.5th percentile
6.5.21
44.2
