Question 6.61
coursestaught
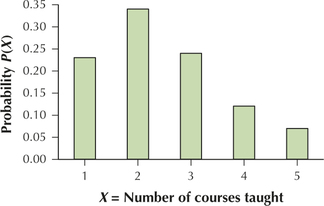
61. Number of Courses Taught. The table provides the probability distribution for X = number of courses taught by faculty at all degree-granting institutions of higher learning in the United States during the fall 2010 semester.1
| ) | |
|---|---|
| 1 | 0.23 |
| 2 | 0.34 |
| 3 | 0.24 |
| 4 | 0.12 |
| 5 | 0.07 |
- Explain why the number of courses taught is a random variable.
- Explain why the number of courses taught is a discrete, and not a continuous, random variable.
- Construct a probability distribution graph for .
- Find .
- Compute .
- Identify the most likely value of .
6.1.61
(a) A faculty member from all degree-granting institutions in the United States is randomly selected. (b) The number of classes taught by a faculty member is counted.
(c)

(d) 0.43 (e) 0.19 (f) 2 classes