EXAMPLE 1 Sampling distribution of for a normal population
In Example 37 in Chapter 6 (page 369), we saw that in the month of April was normally distributed with a mean of and a standard deviation of . We want to compare this population distribution of with the sampling distribution of . Using Minitab, 1000 samples of size were generated from this normal distribution, and the sample means were calculated for each sample. The histogram of green rectangles in Figure 2 was constructed, representing the sampling distribution of for .
- Identify the shape of the sampling distribution of .
- Find the mean of the sampling distribution of .
- Use the Empirical Rule to estimate the standard deviation of the sampling distribution of .
- Compare the population distribution of with the sampling distribution of .
Solution
Figure 2 shows the histogram (rectangles) of the means from the 1000 samples of size .
- As you may have expected, the histogram of rectangles representing the sampling distribution of is normal.
- The balance point of the sampling distribution is located at 61.5. Thus, the mean of the sampling distribution of equals the population mean .
- Figure 2 shows that almost all the sample means lie between 49.5 and 73.5. Recall that the Empirical Rule states that almost all the data from a normal distribution lie within 3 standard deviations of the mean. Thus, the distance represents 3 standard deviations. Thus, we estimate that the standard deviation of the sampling distribution of is: .
398
- Note the orange curve in Figure 2. This represents the distribution of the original normal temperature data, with and . Compare this to the green curve, which represents the sampling distribution of , with mean and . Note that the spread (variability) of the sampling distribution is less than the spread of the original distribution of .
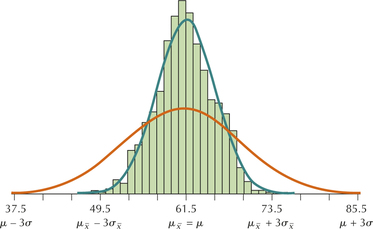 Figure 7.2: FIGURE 2 The sampling distribution of (in green) has less spread (variability) than the original distribution (in orange).
In Example 1, we estimated the standard deviation of the sampling distribution of to be , compared with the original standard deviation . Fact 2 shows the relationship between these two quantities in general.