EXAMPLE 3 Simulation study: sample means from a strongly skewed population
nutrition
The data set Nutrition contains nutrition information on a population of 961 foods.
- Construct a histogram of the potassium content of these 961 foods, and describe the shape of the population distribution.
- Using Minitab, take 500 random samples of sizes from the population. Assess the normality of the resulting sampling distributions of using histograms and normal probability plots.
Solution
- A histogram of the potassium content of these foods is shown in Figure 3, revealing a strongly right-skewed, non-normal data set.
400
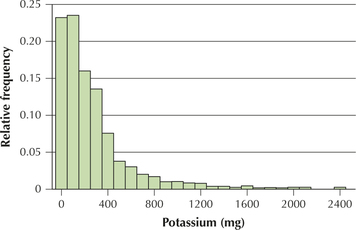 Figure 7.3: FIGURE 3 Potassium content is strongly right-skewed, not normal.
 - Using Minitab, we take 500 random samples of size from the population. The histograms of each set of 500 means are shown in Figure 4.
- : The sampling distribution is skewed (Figure 4a).
- : The sampling distribution of is still somewhat skewed (Figure 4b).
- : Despite a few outliers, the sampling distribution of is approximately normal (Figure 4c).
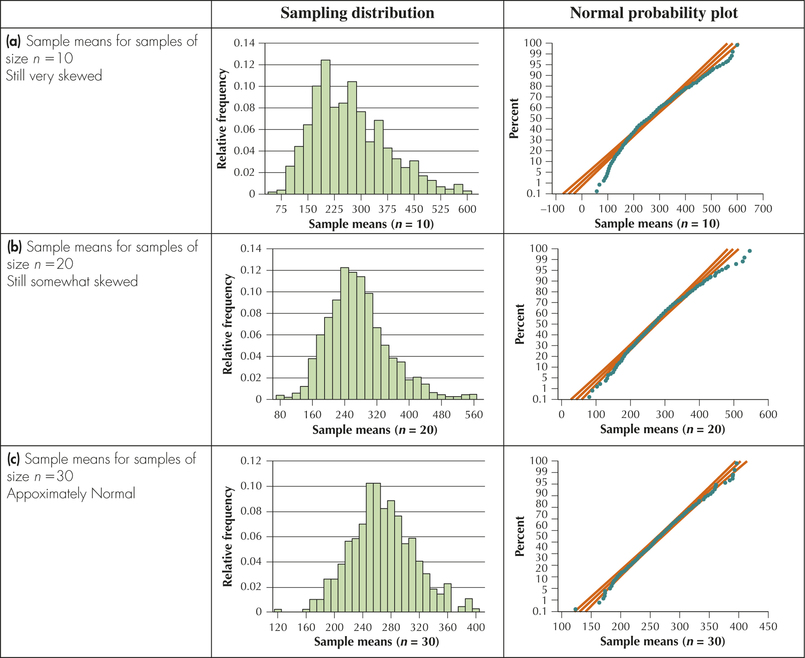 Figure 7.4: FIGURE 4 Sampling distribution of and normal probability plots for .
![]() The Central Limit Theorem applet allows you to experiment with various sample sizes and see how the Central Limit Theorem for Means behaves in action.
The Central Limit Theorem applet allows you to experiment with various sample sizes and see how the Central Limit Theorem for Means behaves in action.