EXAMPLE 7 Finding probabilities using the Central Limit Theorem for Means
fuelefficiency
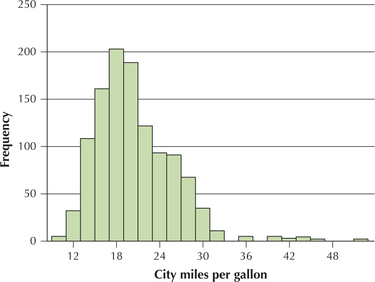
The data set FuelEfficiency contains information about the fuel efficiency of more than one thousand 2014 model year vehicles (Source: fueleconomy.gov). Figure 7 shows a histogram of the city miles per gallon (city mpg) of these vehicles, illustrating that the distribution is not normal, but somewhat right-skewed. The mean city mpg for all vehicles is , and the standard deviation is . Find the probability that a random sample of size vehicles will have a mean city mpg greater than 21.
Solution
Clearly, the population is not normal, but the sample size is large enough, so the Central Limit Theorem applies. The sampling distribution of the sample mean is approximately normal. This is Case 2 from the Three Cases (page 401). Next, we need to find and . Facts 1 and 2 tell us that
406
Therefore, as the CLT indicates, the sampling distribution of is approximately normal . We are then left to solve a normal probability problem using the methods of Section 6.5. Figure 8 shows the sampling distribution of and the probability we are interested in, . Using Fact 4, we standardize:
Thus, , as shown in Figure 9. We therefore look up in the table and subtract this table area (0.8413) from 1 to get the desired tail area:
The probability is 0.1587 that a random sample of 36 vehicles will have a mean city mpg greater than 21.
NOW YOU CAN DO
Exercises 59–70
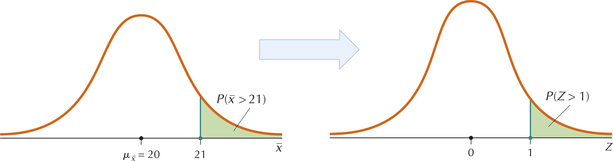
FIGURE 9 Area to the right of .