Question 7.103
103. Tennessee Temperatures. Refer to Exercise 100.
- Find the sample mean temperature that is larger than 97.5% of all such sample means.
- Calculate the sample mean temperature that is smaller than 97.5% of all such sample means.
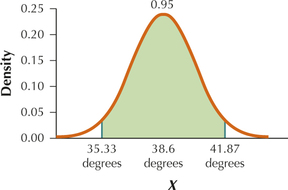
- Draw a graph of the sampling distribution of . Indicate , the two values from (a) and (b), and the area between them.
7.1.103
(a) 41.87 (b) 35.33
(c)