Blood Glucose Levels. Use the following information for Exercises 107–109. The population mean blood glucose levels is with standard deviation . Here is the normal probability plot for the population of patients.
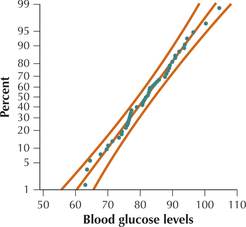
Normal probability plot of blood glucose levels.
Question 7.107
107. Does the normal probability plot show evidence in favor of normality or against normality? What characteristics of the plot illustrate this evidence?
7.1.107
In favor of normality. All of the points are between the curved lines and most of the points are close to the center line.