Blood Glucose Levels. Use the following information for Exercises 107–109. The population mean blood glucose levels is with standard deviation . Here is the normal probability plot for the population of patients.
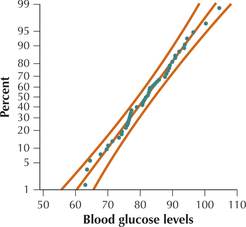
Normal probability plot of blood glucose levels.
Question 7.109
109. If possible, find the probability that a random sample of patients will have a mean blood glucose level greater than 86. If not possible, explain why not.
7.1.109
0 (TI-83/84: 0.0001591)