Adjusted Gross Income. Use the following information for Exercises 110–113. The population mean adjusted gross income for instructors at a certain college is with standard deviation . Here is the normal probability plot for the population of instructors.
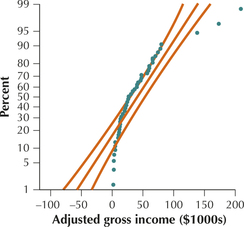
Normal probability plot of adjusted gross income.
Question 7.110
110. Does the normal probability plot show evidence in favor of normality or against normality? What characteristics of the plot illustrate this evidence?