Adjusted Gross Income. Use the following information for Exercises 110–113. The population mean adjusted gross income for instructors at a certain college is with standard deviation . Here is the normal probability plot for the population of instructors.
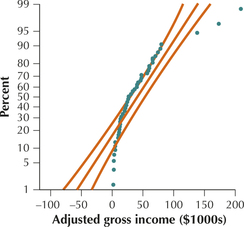
Normal probability plot of adjusted gross income.
Question 7.112
112. If possible, find the probability that a random sample of instructors will have a mean adjusted gross income between $40,000 and $60,000. If not possible, explain why not.