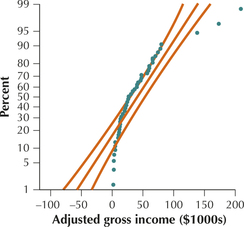
Adjusted Gross Income. Use the following information for Exercises 110–113. The population mean adjusted gross income for instructors at a certain college is with standard deviation . Here is the normal probability plot for the population of instructors.
Question 7.113
 113. Refer to Exercise 112. What if the sample size used was some unspecified value greater than 36? Describe how and why this change would have affected the following, if at all. Would the quantities increase, decrease, remain unchanged? Or is there insufficient information to tell what would happen? Explain your answers.
7.1.113
(a) Remain unchanged. From Fact 1 in Section 7.1, . Thus does not depend on the sample size . (b) Decrease. Since , an increase in the sample size results in a decrease in . (c) Insufficient information to tell. If , then . Since decreases and is positive, will increase. If , then . Thus will remain 0. If , then . Since decreases and is positive, will decrease. (d) Increase. From part (c), will increase and will decrease. Thus the area between these two values will increase. Since is the area between these two values of will increase.