Question 7.169
43. Abandoning Landlines. Refer to Exercise 39.
- Find the 5th and 95th percentiles of the sample proportions.
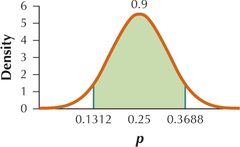
- Draw a graph showing the sampling distribution of , centered at , with the 5th and 95th percentiles, and the area of 0.90 under the curve between them shaded.
- Suppose only 2 of 36 phone users in a sample abandoned their landlines. Would this be considered an outlier? Explain your reasoning. (Hint: Use the Z-score method.)
- Determine which sample proportions would be considered outliers.
7.2.43
(a) 0.1312, 0.3688
(b)

(c) For . Thus is considered moderately unusual. (d) Sample proportions between 0 and 0.0334 inclusive and between 0.4666 and 1 inclusive would be considered outliers.