EXAMPLE 10 Finding the margin of error, given the lower and upper bounds
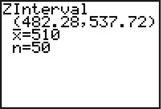
Figure 8 shows the results for a 95% confidence interval for , where represents the population mean score on the SAT Math test. Do the following:
- Report the confidence interval in the form “(lower bound, upper bound).”
- Interpret the confidence interval.
- Calculate the margin of error for the confidence interval.
- Interpret the margin of error.

Solution
The TI-83/84 output gives us the following confidence interval:
We interpret this confidence interval as follows: We are 95% confident that the population mean score on the SAT Math test lies between 482.28 and 537.72.
440
Here, we show how to calculate the margin of error, given the lower bound and upper bound of the confidence interval. The confidence interval from (a) is illustrated in Figure 9.
 Figure 8.9: FIGURE 9 Margin of error equals half the width of the confidence interval.
Now, the width of the margin of error is:
In Figure 9, the width of our confidence interval is:
Then, the margin of error is half this width, as shown in Figure 9. This gives us a margin of error of
- We interpret the margin of error by saying that we can estimate the population mean Math SAT score to within 27.72 points with 95% confidence.
NOW YOU CAN DO
Exercises 43–46.