EXAMPLE 14 Constructing a confidence interval for
cerealsodium
Research has shown that the amount of sodium consumed in food has been associated with hypertension (high blood pressure). The table provides a list of 16 breakfast cereals, along with their sodium contents, in milligrams per serving.
- Determine whether the conditions are met for constructing a interval for the population mean sodium content per serving for all breakfast cereals.
- Find the value of for 99% confidence and degrees of freedom .
- Construct a 99% confidence interval for the population mean sodium content.
- Interpret the meaning of this confidence interval.
| Cereal | Sodium (grams) |
Cereal | Sodium (grams) |
|---|---|---|---|
| Apple Jacks | 125 | Grape Nuts Flakes | 140 |
| Cap'n Crunch | 220 | Kix | 260 |
| Cinnamon Toast Crunch | 210 | Life | 150 |
| Corn Flakes | 290 | Lucky Charms | 180 |
| Count Chocula | 180 | Raisin Bran | 210 |
| Cream of Wheat | 80 | Rice Chex | 240 |
| Fruit Loops | 125 | Special K | 230 |
| Fruity Pebbles | 135 | Total Whole Grain | 200 |
453
Solution
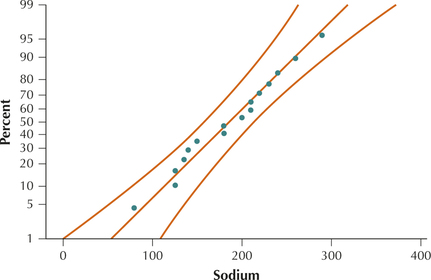
- Figure 17 contains the normal probability plot for the data set. Though not perfect, all points lie within the bounds, indicating acceptable normality. Thus, we proceed to construct the 99% confidence interval.
 Figure 8.17: FIGURE 17 Normal probability plot for sodium in cereal.
 - The value of for 99% confidence and 15 degrees of freedom is 2.947.
A 99% confidence interval for is given by the interval
From the Minitab output in Figure 18, we have , , and . Substituting, we get:
 Figure 8.18: FIGURE 18 Minitab ouput.
- We are 99% confident that , the population mean sodium content per serving of all breakfast cereals, lies between 144.1 grams and 227.7 grams.
NOW YOU CAN DO
Exercises 13–28.