EXAMPLE 16 t intervals for μ using technology
cerealsodium
For the breakfast cereal data in Example 14, construct a 99% confidence interval for the population mean sodium content, using the TI-83/84, Minitab, and SPSS.
Solution
We use the instructions provided in the Step-by-Step Technology Guide below. The sample size n=16 is not large (≤30), so it is necessary to check for normality. Figure 17 indicates acceptable normality.
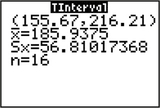
The results for the TI-83/84 in Figure 19 display the 95% t confidence interval for the population mean sodium content to be
(lower bound=155.67, upper bound=216.21)

They also show the sample mean ˉx=185.9375, the sample standard deviation s=56.81017368, and the sample size n=16.
The Minitab results are shown in Figure 20, providing the sample size n = 16, the sample mean ˉx=185.9, the sample standard deviation s = 56.8, the standard error (SE mean) 14.2, and the 95% t confidence interval (155.7, 216.2).

The SPSS results are shown in Figure 21, providing the sample mean ˉx=185.9375, the standard error 14.20254, and the 95% t confidence interval (155.6655, 216.2095).
