EXAMPLE 24 Constructing confidence intervals for the population variance and population standard deviation

 electricmiles
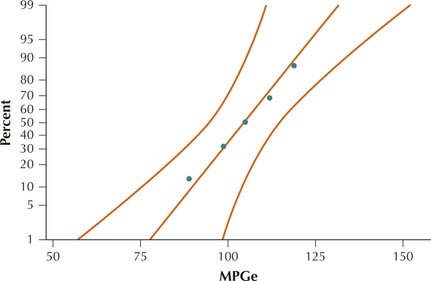
The accompanying table shows the miles-per-gallon equivalent (MPGe) for fve electric cars, as reported by www.hybridcars.com in 2014. The normal probability plot in Figure 38 indicates that the data are normally distributed.

| Electric Vehicle | Mileage (MPGe) |
|---|---|
| Tesla Model S | 89 |
| Nissan Leaf | 99 |
| Ford Focus | 105 |
| Mitsubishi i-MiEV | 112 |
| Chevrolet Spark | 119 |
- Find the critical values and for a confidence interval with a 95% confidence level.
- Construct and interpret a 95% confidence interval for the population variance of electric car MPG.
- Construct and interpret a 95% confidence interval for the population standard deviation of electric car MPG.
electricmiles
Solution
There are electric cars in our sample, so the degrees of freedom equal .
For a 95% confidence interval,
From the table (Table E in the Appendix), therefore,
Figures 39 through 41 show these results using Excel, Minitab, and JMP.
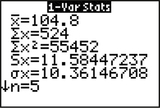
Figure 42 shows the descriptive statistics for MPGe, as obtained by the TI-83/84. The sample standard deviation is .
478
 Figure 8.39: FIGURE 39 Excel results.
 Figure 8.40: FIGURE 40 Minitab results.
 Figure 8.41: FIGURE 41 JMP results.
 Figure 8.42: FIGURE 42 TI-83/84 results.
Thus, our 95% confidence interval for is given by
We are 95% confident that the population variance lies between 48.17 and 1109.09 miles per gallon squared, that is, (MPG)2. (Recall that the variance is measured in units squared.) It is unclear what miles per gallon squared means, so we prefer to construct a confidence interval for the population standard deviation .
- Using the results from part (b),
We are 95% confident that the population standard deviation lies between 6.94 and 33.3 miles per gallon. Figure 43 shows the two confidence intervals obtained using Minitab.

Figure 44 shows the confidence interval for obtained using JMP. We are interested in the bottom row, which has the confidence interval for the population standard deviation .

NOW YOU CAN DO
Exercises 17–32.