EXAMPLE 6 Z intervals for μ using technology
highwaympg16
 Motor Vehicle Fuel Efficiency
Another of the variables in our case study is Highway MPG, which is the number of miles a vehicle can travel on a highway on one gallon of gas. We know the population standard deviation σ=6.326 mpg. The sample of 16 vehicles, shown here, has a sample mean highway gas mileage of ˉx=26.94 mpg.
| Vehicle | Highway MPG | Vehicle | Highway MPG |
|---|---|---|---|
| Honda CR-V | 30 | Subaru Impreza | 25 |
| Nissan Pathfinder | 26 | Ford Mustang | 26 |
| Acura MDX | 28 | Cadillac ATS | 31 |
| Porsche Cayenne | 29 | Chevrolet Camaro | 24 |
| Mercedes-Benz GLK 250 | 33 | Ford Taurus | 29 |
| Chevrolet Chevy SS | 21 | Ford Expedition | 20 |
| Dodge Charger | 27 | Lincoln MKT | 25 |
| Jeep Compass | 23 | BMW X1 | 34 |
- Determine whether the Z interval for μ may be applied.
- Use the TI-83/84, Minitab, and JMP to construct a 95% Z confidence interval for the population mean Highway MPG.
Solution
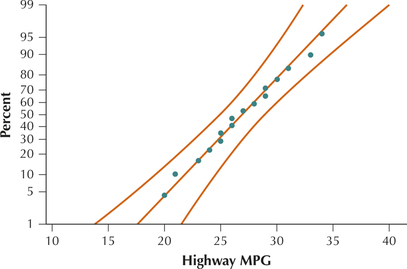
- The sample size n=16 is not large (≥30), so we need to check if the data follow a normal distribution. The normal probability plot of the data in Figure 4 supports the assumption of normality. Further, the population standard deviation is known. We may thus apply the n interval for μ.FIGURE 4 Normal probability plot of the Highway MPG data.

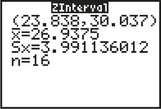
We shall use the instructions provided in the Step-by-Step Technology Guide at the end of this section (page 441). The results for the TI-83/84 in Figure 5 show that the 95% Z confidence interval for the population mean Highway MPG is
lower bound=23.838, upper bound=30.037
Figure 5 also shows the sample mean ˉx=26.9375, the sample standard deviation σ=3.991136012, and the sample size n=16.
 FIGURE 5 TI-83/84 results.
The Minitab results are provided in Figure 6. The “assumed standard deviation” is indicated to be σ=6.326. Then the sample size n=16, the sample mean ˉx=26.94, and the sample standard deviation s=3.99 are displayed. “SE Mean” refers to the standard error of the mean, but we don't need it here. Finally, the 95% confidence interval is given as (lower bound = 23.84, upper bound = 30.04).

The JMP results are shown in Figure 7. The sample mean ˉx=26.9375 is shown in the first column, with the sample standard deviation s=3.991136 below it. The 95% confidence interval is given in the row labeled Mean, with lower bound = 23.84 (rounded) and upper bound = 30.04 (rounded).
