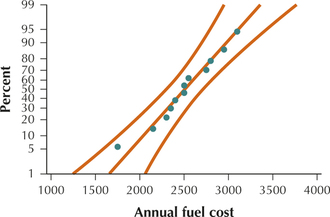
 Chapter 8 Case Study: Motor Vehicle Fuel Efficiency.
Use the following information for Exercises 69–74. The Environmental Protection Agency calculates the estimated annual fuel cost for motor vehicles, with the resulting data provided in the variable annual fuel cost of the Chapter 8 Case Study data set Fuel Efficiency. A sample of the annual fuel cost is provided for 12 vehicles.
| Annual fuel cost | |||
|---|---|---|---|
| 1750 | 2500 | 2400 | 2350 |
| 2150 | 3100 | 2950 | 2500 |
| 2550 | 2750 | 2300 | 2800 |
Question 8.166
69. Construct a normal probability plot of the data (see pages 381–384). Evaluate the normality assumption using the accompanying histogram. Is it appropriate to construct a interval using this data set? Why or why not?
8.2.69

Acceptable normality.