EXAMPLE 12 Finding the -value
For each of the following hypothesis tests, calculate and graph the -value.
To review how to calculate these probabilities, see Table 8 in Chapter 6 on page 355.
Solution
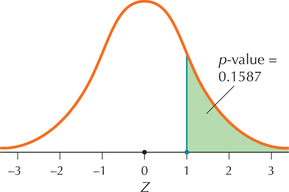
We have a right-tailed test, so that the -value equals the area in the right tail:
The table gives the probability for . Thus,
(Figure 6a)
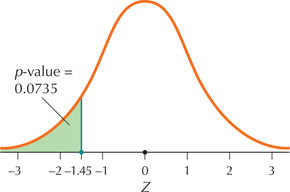
We have a left-tailed test, so that the -value equals the area in the left tail:
(Figure 6b)
509
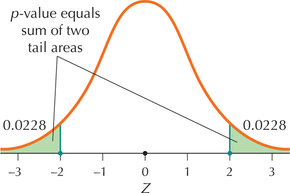
Here, we have a two-tailed test, so that the -value equals the sum of the areas in the two tails:
 Figure 9.6: FIGURE 6a -Value for a right-tailed test.
 Figure 9.7: FIGURE 6b -Value for a left-tailed test.
 Figure 9.8: FIGURE 6c -Value for a two-tailed test.
NOW YOU CAN DO
Exercises 7–20.