EXAMPLE 17 Interpreting software output
Each of (a) and (b) represent software output from a Z test for . For each, examine the indicated software output, and provide the following steps:
- Step 1 State the hypotheses and the rejection rule.
- Step 2 Calculate .
- Step 3 Find the -value.
- Step 4 State the conclusion and interpretation.
Let the level of significance be in each case.
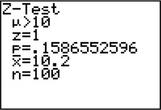
- TI-83/84 output for a Z test for , where represents the population mean length of laboratory mice (in cm)
- Minitab output for a test for , where represents the population mean number of farmer's markets per county, nationwide.
 TI-83/84 output for part (a).
 Minitab output for part (b).
Solution
Interpreting the TI-83/84 output.
Step 1 State the hypotheses and the rejection rule.
In the TI-83/84 output, the “” indicates the alternative hypothesis. In other words, the hypotheses are:
where represents the population mean length of laboratory mice (in cm). We will reject if the -value is less than the level of significance .
519
Step 2 Find .
The “” in the TI-83/84 output provides us the value of the test statistic, .
Step 3 Find the -value.
The “” in the TI-83/84 output represents the -value.
Step 4 State the conclusion and interpretation.
The -value from Step 3 is not less than the level of significance , so we do not reject . There is insufficient evidence that the population mean length of laboratory mice is greater than 10 cm.
- Interpreting the Minitab output.
Step 1 State the hypotheses and the rejection rule.
The first line in the Minitab output is “Test of ,” which indicates a two-tailed test, as follows:
where represents the population mean number of farmer's markets per county. We will reject if the -value is less than the level of significance .
Step 2 Find
Under “” in the Minitab output is found “2.91,” giving us .
Step 3 Find the -value.
Under “” in the Minitab output is “0.004,” representing our -value.
Step 4 State the conclusion and interpretation.
The -value (0.004) from Step 3 is less than the level of significance , so we reject .There is evidence that the population mean number of farmer's markets per county, nationwide, differs from 2.3.