EXAMPLE 18 t Test for μ using critical-value method: Left-tailed test
We are interested in testing, using level of significance α=0.05, whether the mean age at onset of anorexia nervosa in young women has been decreasing. Assume that the previous mean age at onset was 15 years old. Data were gathered for a study of the onset age for this disorder.6 From these data, a random sample (shown here) was taken of n=20 young women who were admitted under this diagnosis to the Toronto Hospital for Sick Children. The Minitab descriptive statistics shown here indicate a sample mean age of ˉx=14.250 years and a sample standard deviation of s=1.512 years. If appropriate, perform the t test.

| 14.50 | 15.75 | 14.17 | 14.00 |
| 14.67 | 17.25 | 11.00 | 16.00 |
| 14.50 | 15.17 | 12.00 | 13.00 |
| 13.00 | 13.50 | 15.42 | 16.08 |
| 14.00 | 12.58 | 13.50 | 14.92 |
Solution
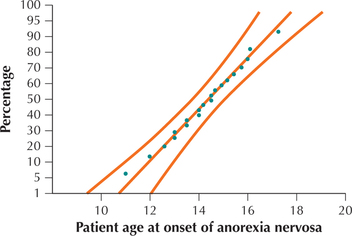
The sample size n=20 is not large, so we need to verify normality. The normal probability plot of the ages at onset in Figure 18 indicates that the ages in the sample are normally distributed. We may proceed to perform the t test for the mean.
Step 1 State the hypotheses.
The key word “decreasing” guides us to state our hypotheses as follows:
H0:μ=15versusHa:μ<15
where μ refers to the population mean age at onset.
Step 2 Find tcrit and state the rejection rule.
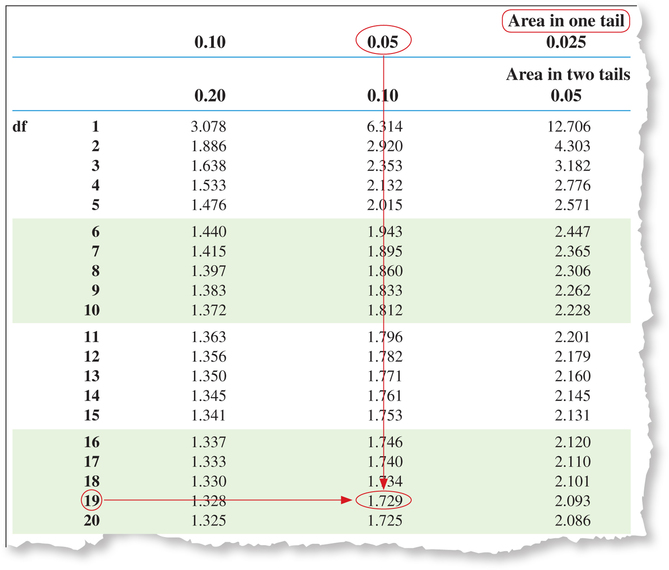
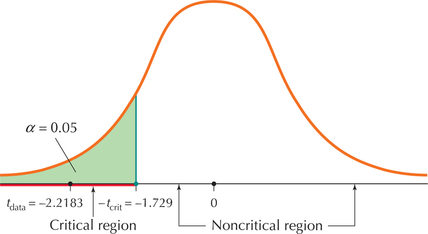
Our hypotheses from Step 1 indicate that we have a left-tailed test, meaning that the critical region represents an area in the left tail (see Figure 20, page 528). To find tcrit, we turn to the t table, an excerpt of which is shown in Figure 19. Because we have a one-tailed test, under “Area in one tail,” select the column with our α value 0.05. Then choose the row with our df=n-1=20-1=19, so that we get tcrit=1.729. Because we have a left-tailed test, the rejection rule from Table 8 is “Reject H0 if tdata≤-tcrit ”; that is, we will reject H0 if tdata≤-1.729.
Page 527FIGURE 18 Normal probability plot for age at onset of anorexia nervosa. FIGURE 19 Finding tcrit for a one-tailed test. For a two-tailed test, use “Area in two tails.”
Step 3 Calculate tdata.
We have n=20, ˉx=14.250, and s=1.512 years. Also, μ0=15, because this is the hypothesized value of μ stated in H0. Therefore, our test statistic is
tdata=ˉx-μ0s/√n=14.250-151.512/√20≈-2.2183
Step 4 State the conclusion and interpretation.
The rejection rule from Step 2 says to reject H0 if tdata≤-1.729. From Step 3, we have tdata=-2.2183. Because −2.2183 is less than −1.729, our conclusion is to reject H0. If you prefer the graphical approach, consider Figure 20, which shows where tdata falls in relation to the critical region. Because tdata=-2.2183 falls within the critical region, our conclusion is to reject H0. There is evidence at level of significance α=0.05 that the population mean age of onset has decreased from its previous level of 15 years.
Page 528 FIGURE 20 Our tdata=-2.2183 falls in the critical region.
NOW YOU CAN DO
Exercises 3–8.