EXAMPLE 21 t Test using the p-value method: Two-tailed test
The Golden Ratio
Euclid's Elements, the Parthenon, the Mona Lisa, and the beadwork of the Shoshone tribe all have in common an appreciation for the golden ratio.
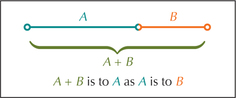
Suppose we have two quantities A and B, with A>B>0. Then A/B is called the golden ratio if
A+BA=AB
that is, if the ratio of the sum of the quantities to the larger quantity equals the ratio of the larger to the smaller (see Figure 25a).
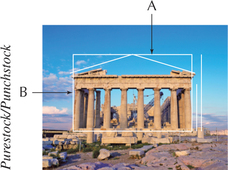
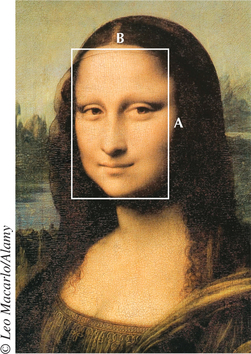
Euclid wrote about the golden ratio in his Elements, calling it the “extreme and mean ratio.” The ratio of the width A and height B of the Parthenon, one of the most famous temples in ancient Greece, equals the golden ratio (Figure 25b). If you enclose the face of Leonardo da Vinci's Mona Lisa in a rectangle, the resulting ratio of the long side to the short side follows the golden ratio (Figure 26). The golden ratio has a value of approximately 1.618.
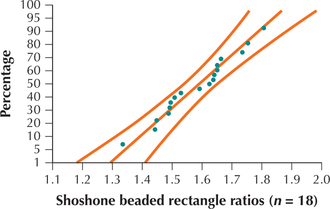
Now, we will test whether evidence exists for the use of the golden ratio in the artistic traditions of the Shoshone, a Native American tribe from the American West. Figure 27 shows a detail of a nineteenth-century Shoshone beaded dress that belonged to Nahtoma, the daughter of Chief Washakie of the Eastern Shoshone.7 It is intriguing to consider whether the Shoshone beaded rectangles, such as those on this dress, follow the golden ratio. Table 10 contains the ratios of lengths to widths of 18 beaded rectangles made by Shoshone artisans.8 We will perform a hypothesis test to determine whether the population mean ratio of Shoshone beaded rectangles equals the golden ratio of 1.618.

shoshone
| 1.44 | 1.75 | 1.64 | 1.66 | 1.64 |
| 1.51 | 1.34 | 1.53 | 1.74 | 1.81 |
| 1.45 | 1.49 | 1.63 | 1.49 | |
| 1.65 | 1.59 | 1.50 | 1.65 |
Solution
The population standard deviation for such rectangles is unknown, so we must use a t test instead of a Z test. Our sample size n=18 is not large, so we must assess whether the data are normally distributed. Figure 28 shows the normal probability plot, indicating acceptable support for the normality assumption. We proceed with the t test, using level of significance α=0.05.
We use the TI-83/84 and CrunchIt! to perform this hypothesis test, using the Step-by-Step Technology Guide at the end of this section.
Step 1 State the hypotheses and the rejection rule.
We are interested in whether the population mean length-to-width ratio of Shoshone beaded rectangles equals the golden ratio of 1.618, so we perform a two-tailed test:
H0:μ=1.618 versus Ha:μ≠1.618
where μ represents the population mean length-to-width ratio of Shoshone beaded rectangles. We will reject H0 if the p-value≤0.05.
Page 533Step 2 Find tdata.
Using the statistics from Figure 29a, we have the test statistic
tdata=ˉx-μ0s/√n=1.583888889-1.6180.1230083158/√18≈-1.176545482≈-1.1765
Step 3 Find the p-value.
From Figures 29a, 29b, and 30, we have
p-value=P(t>|-1.1765|)+P(t<-|-1.1765|)≈0.2556
Step 4 State the conclusion and interpretation.
Because p-value≈0.2556 is not≤α=0.05, we do not reject H0. Thus, there is insufficient evidence, at level of significance α=0.05, that the population mean ratio differs from 1.618. In other words, the data do not reject the claim that Shoshone beaded rectangles follow the same golden ratio exhibited by the Parthenon and the Mona Lisa.
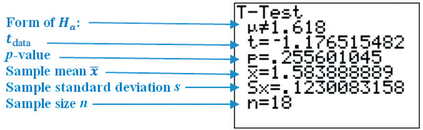 FIGURE 29a TI-83/84 results.
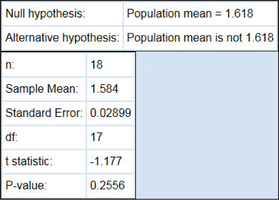 FIGURE 29b CrunchIt! results.
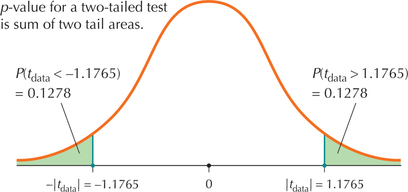 FIGURE 30 p-Value for two-tailed t test is sum of two tail areas.
NOW YOU CAN DO
Exercises 21–26.