EXAMPLE 22 Estimating the p-value using the t table
Suppose we did not have access to technology. Estimate the p-value from Example 19 using the t table (Appendix Table D). For Example 19, our hypotheses are
H0:μ=38versusHa:μ≠38
where μ represents the population mean number of hours worked per week. Our test statistic is tdata=-1.5.
Solution
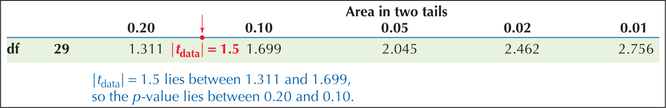
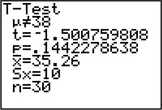
For a two-tailed test, choose the row of the t table with the heading “Area in two tails.” Then select the row in the table with the appropriate degrees of freedom, in this case df=n-1=30-1=29. Note the t-values in this row: 1.311, 1.699, 2.045, 2.462, and 2.756. Think of these values as existing on a horizontal number line. We want to place our tdata=-1.5 somewhere on this number line, but all the t-values in the table are positive. Fortunately, because of the symmetry of the t distribution about zero, we may take |tdata|=1.5. Now, where would |tdata|=1.5 fit on this “number line”? Between 1.311 and 1.699, as indicated in Figure 31, an excerpt from the t table. Therefore, we may estimate the p-value to be between 0.20 and 0.10. In fact, the actual p-value for this problem is about 0.144 (see Figure 32), so that our estimate is confirmed.
NOW YOU CAN DO
Exercises 27–30.