EXAMPLE 24 Interpreting software output
Each of (a) and (b) represent software output from a t test for μ. For each, examine the indicated software output, and provide the following steps:
- Step 1 State the hypotheses and the rejection rule.
- Step 2 Find tdata.
- Step 3 Find the p-value.
- Step 4 State the conclusion and the interpretation.
Use level of significance α=0.10 for each hypothesis test.
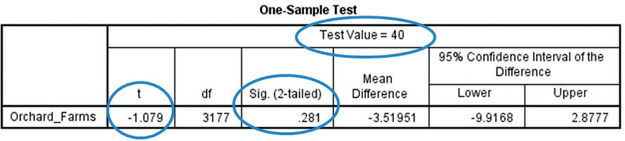
SPSS output for a t test for μ, where μ represents the population mean number of orchard farms per county, nationwide.
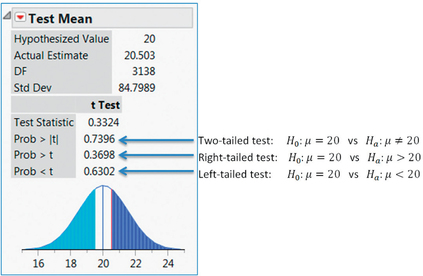
JMP output for a t test for μ, where μ represents the population mean number of grocery stores per county, nationwide.
Solution
- Interpreting the SPSS output.
Step 1 State the hypotheses and the rejection rule.
In the SPSS output, the “Test Value=40” indicates that μ0=40. Also, the “2-tailed” in the output indicates that we have a two-tailed test. Thus, our hypotheses are:
H0:μ=40versusHa:μ≠40
where μ represents the population mean number of orchard farms per county, nationwide. We will reject H0 if the p-value is less than level of significance α=0.10.
Step 2 Find tdata.
Under the “t” in the SPSS is the value for tdata,-1.079.
Step 3 Find the p-value.
The abbreviation “Sig.” stands for “Significance,” which represents the p-value: 0.281.
Step 4 State the conclusion and the interpretation.
The p-value of 0.281 is not less than the level of significance α=0.10, so we do not reject H0. There is insufficient evidence that the population mean number of orchard farms per county differs from 40.
- Interpreting the JMP output.
Step 1 State the hypotheses and the rejection rule.
In the JMP output, the “Hypothesized Value” indicates that μ0=20. Now, JMP is unusual in that it performs all three types of hypothesis test simultaneously: two-tailed, right-tailed, and left-tailed, as shown in the JMP output. It does not specify a particular form of the test. Let us use the right-tailed test for this example. Thus, our hypotheses are:
H0:μ=20vsHa:μ>20
where μ represents the population mean number of grocery stores per county, nationwide. We will reject H0 if the p-value is less than level of significance α=0.10.
Step 2 Find tdata.
Next to “Test Statistic” in the JMP output, we find the value of our test statistic, tdata, 0.3324.
Step 3 Find the p-value.
Here, we need to be careful, because JMP gives us three different p-values, depending on which form of the hypothesis test is performed. We chose the right-tailed test, so our p-value is next to , as indicated in the JMP output.
Step 4 State the conclusion and the interpretation.
The -value of 0.3698 is not less than the level of significance , so we do not reject . There is insufficient evidence that the population mean number of grocery stores per county is greater than 20.
NOW YOU CAN DO
Exercises 37–40.