EXAMPLE 27 Z test for p using the p-value method

We report Zdata to two decimal places to allow the use of the Z table to calculate the p-value.
The National Transportation Safety Board publishes statistics on the number of automobile crashes that people in various age groups have. Young people ages 18–24 have an accident rate of 12%, meaning that on average 12 out of every 100 young drivers per year had an accident. A researcher claims that the population proportion of young drivers having accidents is greater than 12%. Her study examined 1000 young drivers ages 18–24 and found that 134 had an accident this year. Perform the appropriate hypothesis test using the p-value method with level of significance α=0.05.
Solution
First, we check that both of our normality conditions are met. We are interested in whether the proportion has increased from 12%, so we have p0=0.12.
n⋅p0=(1000)(0.12)=120≥5andn⋅q0=(1000)(0.88)=880≥5
The normality conditions are met and we may proceed with the hypothesis test.
Step 1 State the hypotheses and the rejection rule.
Our hypotheses are
H0:p=0.12versusHa:p>0.12
where p represents the population proportion of young people ages 18–24 who had an accident. We reject the null hypothesis if the p-value≤α=0.05.
Step 2 Calculate Zdata.
Our sample proportion is ˆp=134/1000=0.134. Because p0=0.12, the standard error of ˆp is
σˆp=√p0·q0n=√(0.12)(0.88)1000≈0.0103
Thus, our test statistic is
Zdata=ˆp-p0√p0.q0n=0.134-0.12√(0.12)(0.88)1000≈1.36
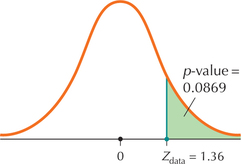
Page 548 FIGURE 36 p-Value for a right-tailed test equals area to right of Zdata.
That is, the sample proportion ˆp=0.134 lies approximately 1.36 standard errors above the hypothesized proportion p0=0.12.
Step 3 Find the p-value.
We have a right-tailed test, so our p-value from Table 12 is P(Z>Zdata). This is a Case 2 problem from Table 8 in Chapter 6 (page 355), where we find the tail area by subtracting the Z table area from 1 (Figure 36):
P(Z>Zdata)=P(Z>1.36)=1-0.9131=0.0869
Step 4 State the conclusion and the interpretation.
The p-value 0.0869 is not ≤ α=0.05, so we do not reject H0. There is insufficient evidence that the population proportion of young people ages 18–24 who had an accident has increased.
NOW YOU CAN DO
Exercises 19–22.