EXAMPLE 28 Performing the Z test for p using technology
A study reported that 1% of American Internet users who are married or in a long-term relationship met on a blind date or through a dating service.13 A survey of 500 American Internet users who are married or in a long-term relationship found 8 who met on a blind date or through a dating service. If appropriate, test whether the population proportion has increased. Use the p-value method with level of significance α=0.05.
Solution
We have p0=0.01 and n=500. Checking the normality conditions, we have
n·p0=(500)(0.01)=5≥5andn·q0=(500)(0.99)=495≥5
The normality conditions are met and we may proceed with the hypothesis test.
Step 1 State the hypotheses and the rejection rule.
Our hypotheses are
H0:p=0.01versusHa:p>0.01
where p represents the population proportion of American Internet users who are married or in a long-term relationship and who met on a blind date or through a dating service. We will reject H0 if the p-value # 0.05.
Step 2 Calculate Zdata.
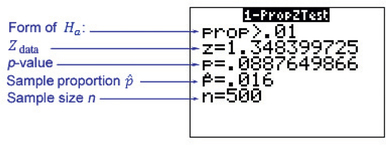
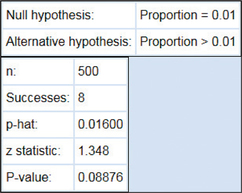
We use the instructions supplied in the Step-by-Step Technology Guide on page 552. Figure 37 shows the TI-83/84 results from the Z test for p, Figure 38 shows the results from Minitab, and Figure 39 shows the results from CrunchIt!.
FIGURE 37 TI-83/84 results. Page 549
Note: Minitab, TI-83/84, and CrunchIt! round results to different numbers of decimal places.
 FIGURE 38 Minitab results.
We have
Zdata=ˆp-p0√p0·q0n=0.016-0.01√(0.01)(0.99)500≈1.348399725
which concurs with the TI-83/84 results in Figure 37.
Step 3 Find the p-value.
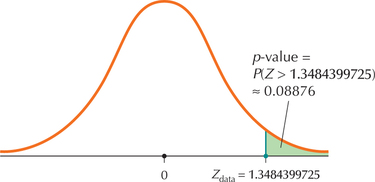
From Figures 37, 38, 39, and 40 we have
p-value=P(Z>1.348399725)=0.0887649866≈0.08876
 FIGURE 39 CrunchIt! results.FIGURE 40 p-Value for a right-tailed test.
Step 4 State the conclusion and interpretation.
Because p-value≈0.08876 is not ≤α=0.05, we do not reject H0. There is insufficient evidence that the population proportion of American Internet users who are married or in a long-term relationship and who met on a blind date or through a dating service has increased.