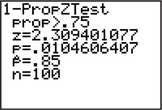
EXAMPLE 30 interpreting software output
Each of (a) and (b) represent software output from a test for . For each, examine the indicated software output, and provide the following steps:
- Step 1 State the hypotheses and the rejection rule.
- Step 2 Find .
- Step 3 Find the -value.
- Step 4 State the conclusion and the interpretation.
Use level of significance for each hypothesis test.
- TI-83/84 output for a test for p, where represents the population proportion of quiz questions answered correctly.

551
- Minitab output for a test for , where represents the population proportion of counties having at least one specialty store.

Solution
- Interpreting the TI-83/84 output
Step 1 State the hypotheses and the rejection rule.
In the TI-83/84 output, the “” tells us that we have a right-tailed test:
where represents the population proportion of quiz questions answered correctly. We will reject if the -value is less than the level of significance
Step 2 Find .
The “” in the TI-83/84 output gives us the value for .
Step 3 Find the -value.
Here, we need to be a little bit careful, because there are two items containing in the TI-83/84 output. Don't pick , which represents the sample proportion of successes. Instead, the -value is given as “.”
Step 4 State the conclusion and the interpretation.
The -value is less than the level of significance , so we reject . There is evidence that the population proportions of quiz questions answered correctly is greater than 0.75.
Interpreting the Minitab output
Step 1 State the hypotheses and the rejection rule.
The line “Test of vs ” tells us that we have the following two-tailed test.
where represents the population proportion of counties having at least one specialty store. We will reject if the -value is less than the level of significance .
Step 2 Find .
The “-value” of 1.46 in the Minitab output gives us the value for .
Step 3 Find the -value.
Under “P-Value,” Minitab gives us .
Step 4 State the conclusion and the interpretation.
The -value is not less than the level of significance , so we do not reject . There is insufficient evidence that the population proportions of counties having at least one specialty store differs from 0.62.
NOW YOU CAN DO
Exercises 27–30.