EXAMPLE 31 test for using the critical-value method
carbonemissions8
| State | Carbon emissions (millions of metric tons) |
|---|---|
| Florida | 230.98 |
| Kentucky | 148.36 |
| Missouri | 135.54 |
| New Hampshire | 16.41 |
| New Mexico | 56.60 |
| New York | 166.32 |
| Tennessee | 105.73 |
| Virginia | 99.86 |
The table contains the carbon emissions from all sources for a random sample of eight states. Test whether the population standard deviation of carbon emissions differs from 60 million metric tons, using level of significance .
558
Solution
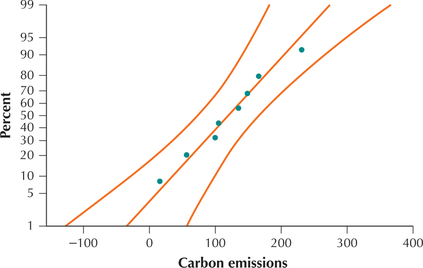
The normal probability plot indicates acceptable normality.

Step 1 State the hypotheses.
The phrase “differs from” indicates that we have a two-tailed test. The value answers the question “Differs from what?” (Note that is 60, and not 60,000,000 because the data are expressed in millions.) Thus, we have our hypotheses:
where represents the population standard deviation of carbon emissions in millions of metric tons.
Step 2 Find the critical values and state the rejection rule.
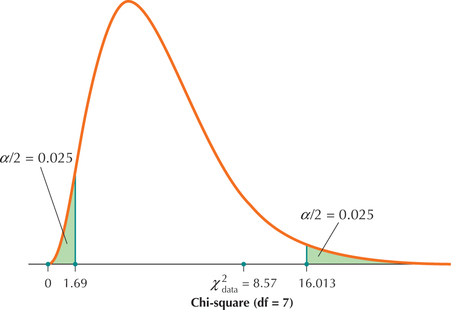
We have , so . Because is given as 0.05, and . Then, from the table (Appendix Table E), we have , and . We will reject if is either or .
Step 3 Find .
The descriptive statistics in Figure 43 tell us that the sample variance is , squared.
 Figure 9.54: FIGURE 43 Descriptive statistics from Minitab.
Thus, our test statistic is:
Step 4 State the conclusion and the interpretation.
In Step 2, we said that we would reject if was either . Because is neither (see Figure 44), we do not reject . There is insufficient evidence at level of significance that the population standard deviation of the state carbon emissions differs from 60 million.
559
 Figure 9.55: FIGURE 44 does not fall in critical region, so do not reject .
NOW YOU CAN DO
Exercises 7–12.