EXAMPLE 32 χ2 test for σ using the p-value method and technology
The table contains the calories in ten entrée food items, courtesy of Food-A-Pedia. Test whether the population standard deviation is larger than 100 calories, using level of significance α=0.05.
entreecalories
| Entrée item | Calories | Entrée item | Calories |
|---|---|---|---|
| Grilled steak | 387 | Ground beef (95% lean, medium patty) |
167 |
| Fried steak | 440 | Grilled pork chop (large) | 314 |
| Breaded fried steak | 600 | Fried pork chop (large) | 326 |
| Ground beef (75% lean, medium patty) |
234 | Meat pizza, thin crust, large | 325 |
| 1 large BBQ short rib with sauce | 148 | Fried catfish (breaded or battered) |
276 |
Solution
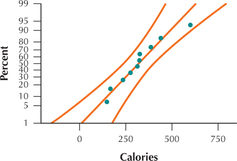
The normal probability plot in Figure 45 indicates acceptable normality, allowing us to proceed with the hypothesis test.

Step 1 State the hypotheses and the rejection rule.
The phrase “larger than” indicates that we have a right-tailed test. The question “Larger than what?” tells us that σ0=100, giving us
H0:σ=100versusHa:σ>100
We reject H0 if the p-value≤α=0.05.
Step 2 Find χ2data.
We use the Step-by-Step Technology Guide on page 562. The Minitab descriptive statistics in Figure 46 tell us that the sample variance is s2=17,742.5 calories squared.
 FIGURE 46 Calories descriptive statistics.
Thus,
χ2data=(n-1)s2σ20=(10-1)(17,742.5)1002≈15.97
Step 3 Find the p-value.
For our right-tailed test, Table 14 tells us that
p-value=P(χ2>χ2data)=P(χ2>15.97)
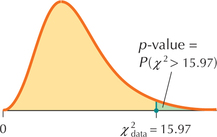
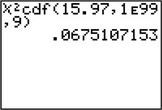
That is, the p-value is the area to the right of χ2data=15.97, as shown in Figure 47. To find the p-value, we use the instructions provided in the Step-by-Step Technology Guide provided at the end of this section. The TI-83/84 results shown in Figure 48 tell us that p-value=P(χ2>15.97)=0.0675107153≈0.0675.
 FIGURE 47 p-Value for χ2 test
 FIGURE 48 TI-83/84 results.
Step 4 State the conclusion and the interpretation.
Because p-value=0.0675 is not ≤α=0.05, we do not reject H0. There is insufficient evidence that the population standard deviation is greater than 100 calories.
NOW YOU CAN DO
Exercises 13–18.