EXAMPLE 34 Calculating β, the probability of a Type II error
ATM network operator Star Systems of San Diego reported that active users of debit cards used them an average of 11 times per month. Suppose we are interested in testing whether people use debit cards on average more than 11 times per month, using level of significance α=0.01. The hypotheses are
H0:μ=11versusHa:μ>11
where μ represents the population mean debit card usage per month. Suppose we have n=36, ˉx=11.5, and σ=3, and from Table 4 (page 500) we have Zcrit=2.33.
- State what a Type II error would be in this case.
- Let μa=13. That is, suppose the population mean debit card usage is actually 13 times per month. Calculate β, the probability of making a Type II error when μa=13.
Solution
- We make a Type II error when we do not reject H0 when H0 is false. In this case, a Type II error would be to conclude that the population mean debit card usage was 11 times per month when in actuality it was more than 11 times per month.
- We follow the steps for calculating β.
Step 1 We have a right-tailed test, so that
ˉxcrit=μ0+zcrit·σ√n=11+2.33·3√36=12.165
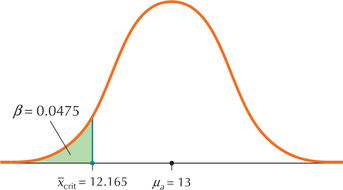
Step 2 Figure 49 shows the normal curve centered at μa=13, with ˉxcrit=12.165 labeled.
FIGURE 49 β probability of Type II error.
Step 3 The right-tailed test tells us that β equals the area under the normal curve drawn in Step 2 to the left of ˉxcrit=12.165. This is the shaded area in Figure 49. Area represents probability, so we have
β=p(ˉx<12.165)when μa=13
Standardizing with μa=13,σ=3, and n=36:
β=P(ˉx<12.165)=P(Z<12.165-133/√36)=P(Z<-1.67)=0.0475
Thus, β=0.0475. This represents the probability of making a Type II error, that is, of not rejecting the hypothesis that the population mean debit card usage is 11 times per month when in actuality it is 13 times per month.
NOW YOU CAN DO
Exercises 5–16.