EXAMPLE 36 Power curve
- Calculate the power of the hypothesis test from Example 34 for the following values of .
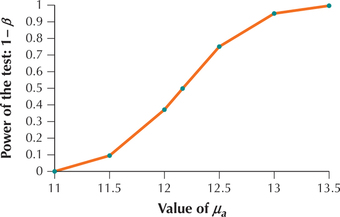
- Construct the power curve by graphing the values for the power of the test on the vertical axis against the values of on the horizontal axis.
Solution
- We have , and . The calculations are provided in the following table.
Probability of Type II error: Power of the test: 11.0 11.5 12.0 12.165 12.5 13.5 Figure 51 represents a power curve, because it plots the values for the power of the test on the vertical axis against the values of on the horizontal axis. Note that, as moves farther away from the hypothesized mean , the power of the test increases. This is because it is more likely that the null hypothesis will be correctly rejected as the actual value of the mean gets farther away from the hypothesized value .
 Figure 9.62: FIGURE 51 Power curve.
For completeness, we include the power for from Example 35 in this power curve.
NOW YOU CAN DO
Exercises 29 and 30.