EXAMPLE 8 Finding and the critical region
For the hypotheses,
where represents the population mean systolic blood pressure, let the level of significance .
- Find the critical value .
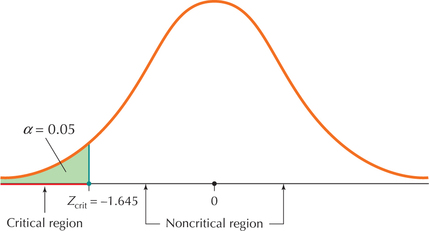
- Graph the distribution of , showing the critical region.
Solution
We have a left-tailed test and level of significance , so Table 4 tells us that the critical value is . The graph showing the critical region is provided in Figure 2. We would reject for values of that are .

Figure 9.2: FIGURE 2 Critical region for a left-tailed test lies in the left (lower) tail.
NOW YOU CAN DO
Exercises 23–26.