Question 9.181
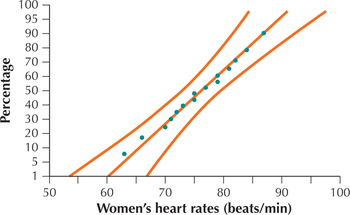
75. Women's Heart Rates. A random sample of 15 women produced the normal probability plot for their heart rates shown here. The sample mean was 75.6 beats per minute. Suppose the population standard deviation is known to be 9.

- Discuss the evidence for or against the normality assumption. Should we use the test? Why or why not?
- Assume that the plot does not contradict the normality assumption; test whether the population mean heart rate for all women is less than 78, using level of significance .
- Test whether the population mean heart rate for all women differs from 78, using .
9.3.75
(a) Yes, the normal probability plot indicates acceptable normality. (b) . Reject if , , . Since is not , do not reject . There is insufficient evidence at level of significance that the population mean heart rate for all women is less than 78 beats per minute.
(c) . Reject if . . . Since is not , do not reject . There is insufficient evidence that the population mean heart rate for all women is different from 78 beats per minute.