Question 9.382
31. Stock Market. The Statistical Abstract of the United States reports that the mean daily number of shares traded on the New York Stock Exchange in 2009 was 2.9 billion. Let this value represent the hypothesized population mean, and assume that the population standard deviation equals 0.7 billion shares. Suppose that we have a random sample of 36 days from the present year, and we are interested in testing whether the population mean daily number of shares traded has increased, using level of significance .
- Describe what a Type II error would mean in the context of this problem.
- What is the probability of making a Type II error when the actual mean number of shares traded equals the following values?
- 3.0 billion
- 3.1 billion
- 3.2 billion
- 3.3 billion
- Calculate the power of the hypothesis test for the values of given in (b).
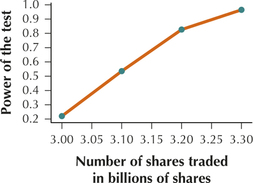
- Construct the power curve for the values of given in (b).
9.7.31
(a) Concluding that the population mean daily number of shares traded equals 2.9 billion shares when, in reality, it has increased from 2.9 billion shares.
(b) and (c)
| Probability of Type 11 error: β | Power of Test: | ||
|---|---|---|---|
| (i) | 3.0 billion | ||
| (ii) | 3.1 billion | ||
| (iii) | 3.2 billion | ||
| (iv) | 3.3 billion |
(d)
