For Exercises 49–56, do the following:
- State the hypotheses.
- Find and the critical region.
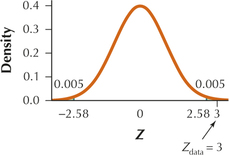
- Find . Also, draw a standard normal curve showing , the critical region, and .
- State the conclusion and the interpretation.
Question 9.86
51. Text Messages. The Pew Internet and American Life Project reports that young people ages 12–17 send a mean of 60 text messages per day. A random sample of 100 young people showed a mean of 69 text messages per day. Assume . Test, using level of significance , whether the population mean number of text messages per day differs from 60.
9.2.51
(a) (b) . Reject if or (c)

(d) is . Therefore we reject . There is evidence at level of significance that the population mean number of text messages sent per day for young people ages 12–17 differs from 60.