Chapter 11 Review Exercises
section 11.1
For Exercises 1–4, perform the χ2 goodness of fit test.
Question 11.76
1. Truck-Hauled Trade. According to the U.S. Census Bureau, 32% of North American international truck-hauled trade (in dollars) goes from the United States to Canada, 22% goes from the United States to Mexico, 31% goes from Canada to the United States, and 15% goes from Mexico to the United States. Suppose that a new survey showed that $25 billion went from the United States to Canada, $15 billion went from the United States to Mexico, $20 billion went from Canada to the United States, and $10 billion went from Mexico to the United States. Test whether the population proportions of truck-hauled trade have changed, using level of significance α=0.05.
11.99.1
H0:pUS Can=0.32, pUS Mex=0.22, pCan US =0.31, pMex US =0.15. Ha : The random variable does not follow the distribution specified in H0. EUS Can =$22.4 billion, EUS Mex =$15.4 billion, ECan US =$21.7 billion, EMex US =$10.5 billion. Since none of the expected frequencies is less than 1 and none of the expected frequencies is less than 5, the conditions for performing the χ2 goodness of ft test are met. Reject H0 if p-value ≤0.05. χ2data=0.469. p-value =0.9256. Since p-value is not ≤0.05, we do not reject H0. There is insufficient evidence that the population proportions of truck-hauled trade have changed.
Question 11.77
2. Alcohol Abuse and Dependence in College. A report found that 25% of college students had abused alcohol in the last 12 months, whereas an additional 6% (not counted in the 25%) were alcohol-dependent.9 Suppose that a new survey of 1000 randomly selected college students finds 275 who had abused alcohol in the last 12 months and an additional 50 (not counted in the 275) who are alcohol-dependent. Test whether the population proportions have changed, using level of significance α=0.10.
Question 11.78
marylandlotto
3. Truly Random Lottery Drawing? Have you ever wondered whether lottery drawings are truly random? For example, the accompanying histogram shows the frequencies of the third digit in the Maryland lottery's Pick 3 game (218 drawings from September 1989 to April 1990). In a Pick 3 game, you choose a three-digit number between 000 and 999, and if your number comes up, you win the cash prize. Notice that 1 appears as the third digit least of all the digits, and quite a bit less often than some of the other digits. Does the relative scarcity of 1s indicate that the system is flawed?
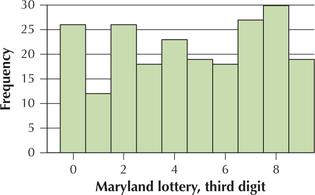
The relative frequency distribution of the third digit is shown in the following table. We would, of course, expect each digit to show up 10% of the time. Test whether the population proportions of digits are all 0.10, using level of significance α=0.05.
| Digit | Count | Percent |
|---|---|---|
| 0 | 26 | 11.93 |
| 1 | 12 | 5.50 |
| 2 | 26 | 11.93 |
| 3 | 18 | 8.26 |
| 4 | 23 | 10.55 |
| 5 | 19 | 8.72 |
| 6 | 18 | 8.26 |
| 7 | 27 | 12.39 |
| 8 | 30 | 13.76 |
| 9 | 19 | 8.72 |
| N= | 218 |
11.99.3
H0:p0=0.10, p1=0.10, p2=0.10, p3=0.10, p4=0.10, p5=0.10, p6=0.10, p7=0.10, p8=0.10, p9=0.10. Ha : Not all the proportions in H0 are equal. Reject H0 if p-value ≤0.05. E0=21.8, E1=21.8, E2=21.8, E3=21.8, E4=21.8, E5=21.8, E6=21.8, E7=21.8, E8=21.8, E9=21.8. Since none of the expected frequencies is less than 1 and none of the expected frequencies is less than 5, the conditions for performing the χ2 goodness of fit test are met. Reject H0 if p-value ≤0.05. χ2data=12.4587. p-value =0.1886664729. Since the p-value is not ≤0.05, we do not reject H0. There is insufficient evidence that the population proportions of digits are not all 0.10.
Question 11.79
4. Alternative Medicine Use. A study examined the prevalence of alternative medicine usage by age group among persons with diabetes.10 In the study, 5.7% of the subjects were ages 18–34 years, 20.7% were ages 35–49 years, 38.8% were ages 50–64 years, and 34.8% were age 65 or older. Suppose that a study conducted this year found that, of the 1000 randomly selected respondents with diabetes, 70 were 18–34 years old, 220 were 35–49 years old, 440 were 50–64 years old, and 270 were over age 65. Test, using level of significance α=0.05, whether the proportions have changed.
section 11.2
Question 11.80
highschoolgpa
5. Grades and the SAT. In its “Profile of College-Bound Seniors,” the College Board provided the following data on high school grade point average and gender for the students taking the SAT exam. We are interested in testing whether the proportion of females is the same across the six grade categories.
| High school grade point average | ||||||
|---|---|---|---|---|---|---|
| Gender | A+ | A | A− | B | C | D–F |
| Female | 60 | 62 | 59 | 53 | 43 | 43 |
| Male | 40 | 38 | 41 | 47 | 57 | 57 |
- Before you perform any calculations, what result might we expect? Examine the table carefully to see whether you can identify any differences in the proportions of females.
- Test whether the proportion of females is the same across the six grade categories, using level of significance α=0.05.
11.99.5
(a) A higher proportion of the females with high GPAs take the SAT exam than the proportion of the females with lower GPAs. (b) H0:pA+=pA−=pA−=pB=pC=pD/F. Ha : Not all the proportions in H0are equal. Reject H0 if p-value ≤0.05. Since none of the expected frequencies is less than 1 and none of the expected frequencies is less than 5, the conditions for performing the χ2 test for homogeneity of proportions are met. χ2data=14.6786. p-value =0.0118277763. Since the p-value ≤0.05, we reject H0. There is evidence that the proportion of females is not all the same across the six grade categories.
Question 11.81
6. Pregnancy and HIV Testing. A study examined the proportions of pregnant women in the United States who have had an HIV test in the past 12 months.11 The proportions for the Northeast, Midwest, South, and West, resulting from four separate samples, were 56.8%, 49.3%, 58.5%, and 50.2%, respectively. Test whether the population proportions of pregnant women who have had an HIV test in the past 12 months are the same across all four regions, using level of significance α=0.01. Assume that each sample size equals 1000.
Question 11.82
7. Radio-Listening Trends. The Arbitron Corporation tracks radio-listening trends among demographic groups. In a survey, 240 teens ages 12–17 listened to pop contemporary hit radio stations, whereas 170 teens listened to alternative radio stations. Also, 250 young adults ages 18–24 listened to pop contemporary hit radio stations, whereas 260 young adults listened to alternative radio stations. Test whether age and radio station type are independent, using level of significance α=0.05.
11.99.7
H0: Age and radio station type are independent. Ha : Age and radio station type are not independent. Reject H0 if p-value ≤0.05. Since none of the expected frequencies is less than 1 and none of the expected frequencies is less than 5, the conditions for performing the χ2 test for independence are met. χ2data=8.269. p-value =0.0040. Since p-value ≤0.05, we reject H0. There is evidence that age and radio station type are not independent.
Question 11.83
happymarriage
8. Happiness in Marriage. The General Social Survey tracks trends in American society. The accompanying crosstabulation shows the responses to a question that asked people to characterize their feelings about being married. Test whether happiness in marriage is independent of gender, using level of significance α=0.05.
| Happiness in marriage | ||||
|---|---|---|---|---|
| Respondents' gender |
Very happy |
Pretty happy |
Not too happy |
Total |
| Male | 242 | 115 | 9 | 366 |
| Female | 257 | 149 | 17 | 423 |
| Total | 499 | 264 | 26 | 789 |