Chapter 12 Review Exercises
section 12.1
Question 12.141
1. For the following data, assume that the ANOVA assumptions are met, and calculate the measures in (a)–(b).
| Sample A | Sample B | Sample C | Sample D |
|---|---|---|---|
| ˉxA=0 | ˉxB=10 | ˉxC=20 | ˉxD=10 |
| sA=1.5 | sB=2.25 | sC=1.75 | sD=2.0 |
| nA=50 | nB=100 | nC=50 | nD=100 |
- df1 and df2
- ˉˉx
- SSTR
- SSE
- SST
- MSTR
- MSE
- Fdata
12.99.1
(a) df1=3, df2=296 (b) 10 (c) 10,000 (d) 1,157.5 (e) 11,157.5 (f) 3,333.3333 (g) 3.910472973 (h) 852.4117985
Question 12.142
2. Construct the ANOVA table for the statistics in Exercise 1.
For Exercises 3–5, assume that the ANOVA assumptions are met and perform the appropriate analysis of variance using a=0.05.
Question 12.143
medicaltreatmt
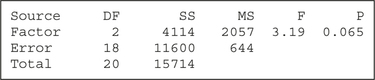
3. Differences in Medical Treatments. A psychologist is interested in investigating whether differences in mean client improvement exist for three medical treatments. Seven clients undergoing each medical treatment were asked to rate their level of satisfaction on a scale of 0 to 100. The data are provided in the following table.
| Medical treatment 1 |
Medical treatment 2 |
Medical treatment 3 |
|---|---|---|
| 75 | 75 | 100 |
| 100 | 100 | 100 |
| 0 | 25 | 50 |
| 50 | 75 | 90 |
| 50 | 50 | 75 |
| 40 | 75 | 75 |
| 25 | 60 | 90 |
12.99.3
H0:μ1=μ2=μ3. Ha: Not all the population means are equal. μ1= population mean level of satisfaction for Medical Treatment 1. μ2= population mean level of satisfaction for Medical Treatment 2. μ3= population mean level of satisfaction for Medical Treatment 3. Fcrit=3.55. Reject H0 if Fdata≥3.55. Fdata=3.19. Since Fdata is not ≥3.55 we do not reject H0. There is insufficient evidence that not all of the population means are equal.
Question 12.144
customersatisfy
4. Customer Satisfaction. The district sales manager of a local chain store wants to determine whether significant differences exist in the mean customer satisfaction among the four franchise stores in her district. Customer satisfaction data were gathered over seven days at each of the four stores. The resulting data are summarized in Table 13.
| Store A | Store B | Store C | Store D |
|---|---|---|---|
| 50 | 60 | 25 | 75 |
| 40 | 45 | 30 | 60 |
| 60 | 70 | 50 | 80 |
| 60 | 70 | 30 | 90 |
| 50 | 60 | 40 | 70 |
| 45 | 65 | 25 | 85 |
| 55 | 70 | 45 | 95 |
| ˉxA=51.43 | ˉxB=62.86 | ˉxC=35.00 | ˉxD=79.29 |
| sA=7.48 | sB=9.06 | sC=10.00 | sD=12.05 |
section 12.2
For Exercises 5–7, use the summary statistics to calculate the value of the test statistic tdata for the Bonferroni method.
Question 12.145
5. ˉx1=50, ˉx2=75, MSE = 1250, n1=25, n2=25
12.99.5
tdata=−2.5
Question 12.146
6. ˉx1=50, ˉx3=65, MSE = 1250, n1=25, n3=25
Question 12.147
7. ˉx2=75, ˉx3=65, MSE = 1250, n2=25, n3=25
12.99.7
tdata=1
Question 12.148
8. Perform multiple comparisons using the Bonferroni method at level of significance α=0.05 for the data in Exercises 5–7. Assume the requirements are met. Do the following:
- For each hypothesis test, state the hypotheses and the rejection rule.
- Use the value of tdata from Exercises 5–7 for each hypothesis test.
- Find the Bonferroni-adjusted p-value for each hypothesis test.
- For each hypothesis test, state the conclusion and the interpretation.
For Exercises 9–11, use the summary statistics to calculate the value of the test statistic qdata for Tukey's test.
Question 12.149
9. ˉx1=200, ˉx2=224, MSE = 14,400, n1=100, n2=100
12.99.9
qdata=2
Question 12.150
10. ˉx1=200, ˉx3=248, MSE = 14,400, n1=100, n2=100
Question 12.151
11. ˉx2=224, ˉx3=248, MSE = 14,400, n1=100, n2=100
12.99.11
qdata=2
Question 12.152
12. Find the Tukey critical value qcrit for experimentwise error rate αEW=0.05, n1=100, n2=100, n3=100.
Question 12.153
13. Perform multiple comparisons using Tukey's test at experimentwise error rate αEW=0.05, for the data in Exercises 9–11. Assume the requirements are met. Do the following.
- For each hypothesis test, state the hypotheses.
- Use the value of qcrit from Exercise 12, and state the rejection rule.
- Use qdata from Exercises 9–11 for each hypothesis test.
- For each hypothesis test, state the conclusion and the interpretation.
12.99.13
(a) Test 1: H0:μ1=μ2 vs Ha:μ1≠μ2; Test 2: H0:μ1=μ3 vs Ha:μ1≠μ3. Test 3: H0:μ2=μ3 vs Ha:μ2≠μ3. (b) qcrit=3.356. Reject H0 if qdata≥3.356. (c) Test 1: qdata=2; Test 2: qdata=4; Test 3: qdata=2 (d) Test 1:qdata=2, which is not ≥3.356; therefore we do not reject H0. There is insufficient evidence at the α=0.05 level of significance that the population mean of Population 1 differs from the population mean of Population 2. Test qdata=4, which is ≥3.356; therefore we reject H0. There is evidence at the α=0.05 level of significance that the population mean of Population 1 differs from the population mean of Population 3. Test qdata=2, which is not ≥3.356; therefore we do not reject H0. There is insufficient evidence at the α=0.05 level of significance that the population mean of Population 2 differs from the population mean of Population 3.
section 12.3
Question 12.154
14. For the partially completed randomized block ANOVA table, do the following:
- Provide the hypotheses.
- Complete the missing entries in the table.
- Use technology to find the p-value. For level of significance a=0.05, provide the conclusion and the interpretation.
| Source | Sum of squares |
Degrees of freedom |
Mean square |
F |
|---|---|---|---|---|
| Treatments | — | — | — | 2 |
| Blocks | 420 | 5 | — | |
| Error | 200 | 20 | 10 | |
| Total | 700 | — |
Question 12.155
genderindustry
15. The following table represents an excerpt from a U.S. Census Bureau report on the numbers of small businesses owned by females and males in four industries. Perform the randomized block design ANOVA using level of significance α=0.05.
| Block: Industry | Factor of interest: Gender of owner |
||
|---|---|---|---|
| Female | Male | ||
| Retail | 9 | 11 | |
| Real estate | 5 | 11 | |
| Health care | 20 | 10 | |
| Entertainment | 3 | 5 | |
12.99.15
H0:μwomen=μmen vs Ha: Not all of the population means are equal. Reject H0 if p-value≤ 0.05. The p-value= 1.000, which is not ≤0.05; therefore we do not reject H0. There is insufficient evidence at level of significance α=0.05 that the population mean number of small businesses owned by women differs from the population mean number of small businesses owned by men.
section 12.4
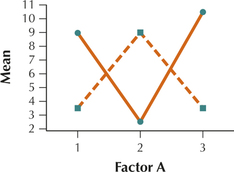
For the data in Exercises 16 and 17, draw an interaction plot and determine whether there exists no interaction, some interaction, or substantial interaction.
Question 12.156
16.
| Factor B | Factor A | ||||||
|---|---|---|---|---|---|---|---|
| A1 | A2 | A3 | |||||
| B1 | 100 | 95 | 120 | 115 | 85 | 80 | |
| B2 | 120 | 125 | 150 | 155 | 100 | 95 | |
Question 12.157
17.
| Factor B | Factor A | ||||||
|---|---|---|---|---|---|---|---|
| A1 | A2 | A3 | |||||
| B1 | 10 | 8 | 3 | 2 | 12 | 9 | |
| B2 | 3 | 4 | 11 | 7 | 5 | 2 | |
12.99.17
There is significant interaction between Factor A and Factor B.
For Exercises 18 and 19, use level of significance α=0.05 to do the following for the indicated data:
- Test for interaction. Confirm that the result agrees with the interaction plot you constructed.
- If appropriate, test for the Factor A effect.
- If appropriate, test for the Factor B effect.
Question 12.158
18. Data in Exercise 16
Question 12.159
19. Data in Exercise 17
12.99.19
(a) H0: There is no interaction between carrier (Factor A) and type (Factor B). Ha: There is interaction between carrier (Factor A) and type (Factor B). Reject H0 if the p-value≤ 0.05. The p-value=0.004, which is ≤0.05; therefore we reject H0. There is evidence of interaction between carrier (Factor A) and type (Factor B) at level of significance α=0.05. This result agrees with the interaction plot in Exercise 17. (b) Not appropriate (c) Not appropriate