1.3 Gathering Data
 This page includes Video Technology Manuals
 This page includes Statistical Videos
OBJECTIVES By the end of this section, I will be able to …
- Explain what a random sample is, and why we need one.
- Identify systematic sampling, stratified sampling, cluster sampling, and convenience sampling.
- Explain selection bias and good questionnaire design.
- Understand the difference between an observational study and an experiment.
1 Random Sampling
We can use the information gathered from a sample to generalize about the population when it is impractical or impossible to take a census of the entire population. However, if we get a “bad” sample, the information gleaned from the sample will be misleading, with potentially catastrophic consequences. This section introduces a method of sampling that minimizes many potential biases, which could lead to incorrect generalizations about the population. This sampling method is called random sampling. Everyday examples of random sampling include:
- randomly selecting lottery numbers from a basket that continuously churns the number-balls,
- randomly choosing one card from a deck of playing cards that has been well shuffled, and
- randomly pulling a name out of a hat, after the names have been well stirred.
Because random samples are not always practical or desirable, this section also discusses some of the many alternative sampling methods available, including stratified sampling and cluster sampling.
What Is a Random Sample, and Why Do We Need It?
Survey sampling, or polling, has now become so widespread that hardly a day goes by without the results of some new poll or survey making the headlines. Polls are a good example of statistical sampling at work. The pollsters canvass about 1000 or so respondents, analyze the sample results, and then report their statistical inference that, for example, “32% of Americans have used a cell phone to access the Internet.”
Today, many polls are conducted quite scientifically, and their results are usually very accurate. However, such was not always the case. In 1936, the Literary Digest had correctly predicted the past three presidential elections and went to work to predict the winner of the contest between Republican Alf Landon and Democrat Franklin Roosevelt. The magazine sent ballots to 10 million citizens. The results ran strongly in favor of Landon, leading the Literary Digest to predict Landon to win the election. About 25% of the ballots were returned, giving the newsweekly a sample size of 2.5 million. George Gallup, on the other hand, was working with a sample size that was about 1000 times smaller than the Literary Digest's. However, Gallup predicted a victory for Roosevelt. Clearly, with more data, the Literary Digest should have been able to give a more accurate prediction, right? Not necessarily. Roosevelt won in a landslide, and the embarrassed Literary Digest later declared bankruptcy.
The problem stemmed from the way that the Literary Digest identified its sample. It used lists of people who owned cars and had telephones, which in the 1930s excluded millions of poor and underprivileged people, who overwhelmingly supported Roosevelt. Its sample of 2.5 million, therefore, was highly biased toward the richer folks, who were less likely to have any great fondness for Roosevelt and his New Deal policies. Gallup, on the other hand, chose his sample more scientifically, and even though his sample size was smaller, it was more representative of the population as a whole.
One inexpensive way of eliminating many types of bias is to make sure your sample is a random sample.
A random sample (also known as a simple random sample) is a sample for which every element of the population has an equal chance of being selected.
Note: When we take a sample, we usually discard any repeated elements because we already have their information.
For example, today, the Gallup polling organization uses random digit dialing, a computer program that generates random four-digit numbers, which are then appended to the telephone exchanges and area codes. Thus, each household phone number in America has an equal chance of being included in the sample, regardless of whether it is listed or unlisted.
![]() Random samples may be generated using technology, using the Simple Random Sample applet, or using the random number table provided in Table A in the Appendix (page T-2). At the end of this section, we demonstrate how to generate random samples using the TI-83/84 graphing calculator, Excel, Minitab, SPSS, JMP, and CrunchIt!. The Simple Random Sample applet allows you to produce a random sample of up to 100 elements, in the form of a lotto.
Random samples may be generated using technology, using the Simple Random Sample applet, or using the random number table provided in Table A in the Appendix (page T-2). At the end of this section, we demonstrate how to generate random samples using the TI-83/84 graphing calculator, Excel, Minitab, SPSS, JMP, and CrunchIt!. The Simple Random Sample applet allows you to produce a random sample of up to 100 elements, in the form of a lotto.
EXAMPLE 12 Generating a random sample using technology
 Video Game Sales
Recall the top 30 best-selling video games in the United States for the week of May 17, 2014, shown in Table 3 on page 8; use the TI-83/84, Excel, Minitab, or SPSS to generate a random sample of 7 video games from this list.
Solution
We used the instructions provided in the Step-by-Step Technology Guide at the end of this section (page 30) to create four random samples, listed below. Note that each random sample is different, as yours will be.
| Random sample 1 using the TI-83/84 | Random sample 2 using Excel |
|---|---|
| 28. Nintendo Land for Wii U | 3. Kirby: Triple Deluxe for 3DS |
| 7. Bound by Flame for PS4 | 17. Battlefield 4 for Xbox 360 |
| 25. Yoshi's New Island for 3DS | 16. Borderlands 2 for PSV |
| 6. Call of Duty: Ghosts for Xbox 360 | 5. Titanfall for Xbox One |
| 4. MLB 14 The Show for PS4 | 25. Yoshi's New Island for 3DS |
| 2. Minecraft for Xbox 360 | 24. Super Mario 3D World for Wii U |
| 20. inFamous: Second Son for PS4 | 28. Nintendo Land for Wii U |
| Random sample 3 using Minitab | Random sample 4 using SPSS |
|---|---|
| 23. Spiderman 2 for PS4 | 22. NBA 2K14 for Xbox 360 |
| 25. Yoshi's New Island for 3DS | 28. Nintendo Land for Wii U |
| 24. Super Mario 3D World for Wii U | 18. Forza Motorsport 5 for Xbox One |
| 30. NBA 2K14 for PS4 | 8. Pokemon X/Y for 3DS |
| 15. Call of Duty: Ghosts for PS3 | 2. Minecraft for Xbox 360 |
| 9. Titanfall for Xbox 360 | 4. MLB 14 The Show for PS4 |
| 13. Super Luigi U for Wii U | 7. Bound by Flame for PS4 |
NOW YOU CAN DO
Exercises 7–10.
2 More Sampling Methods
In certain circumstances, simple random sampling can have shortcomings. A simple random sample may not provide sufficient information about subgroups within the population. For example, suppose you are interested in knowing the proportion of 19- to 22-year-olds in Walnut, California, who consume caffeine. A random sample size of 100 of all the residents in Walnut may yield only a dozen 19- to 22-year-olds, which may be too small a sample to be useful for statistical inference. Therefore, the researcher needs other methods for obtaining samples, depending on the situation and the research question.
Note: Most of the sampling methods mentioned here involve randomness. However, only the simple random sample is used throughout the text. Therefore, whenever you see the phrase random sample, it should be understood as simple random sample.
Systematic Sampling
Perhaps the easiest method of sampling is systematic sampling, which is used when a random sample is unobtainable. In systematic sampling, each element of the population is numbered, and the sample is obtained by selecting every kth element, where k is some whole number. The first element selected corresponds to a random whole number between 1 and k. The ancient Romans understood well how to use systematic sampling. When a Roman legion mutinied or showed cowardice in battle, every 10th member was selected and summarily executed before his comrades. Literally, the legion was decimated, from the Latin decem, meaning “ten.”
EXAMPLE 13 Systematic sampling
20richest
Table 9 contains the top 20 richest people in the world for the year 2014, according to the annually published Forbes 400 listing. Obtain a systematic sample from this list, using k=4.
| Rank | Name | Net worth ($ billions) |
Rank | Name | Net worth ($ billions) |
|---|---|---|---|---|---|
| 1 | Bill Gates | 72 | 11 | Sheldon Adelson | 28.5 |
| 2 | Warren Buffett | 58.5 | 12 | Jeff Bezos | 27.2 |
| 3 | Larry Ellison | 41 | 13 | Larry Page | 24.9 |
| 4 | Charles Koch | 36 | 14 | Sergey Brin | 24.4 |
| 5 | David Koch | 36 | 15 | Forrest Mars | 20.5 |
| 6 | Christy Walton | 35.4 | 16 | Jacqueline Mars | 20.5 |
| 7 | Jim Walton | 33.8 | 17 | John Mars | 20.5 |
| 8 | Alice Walton | 33.5 | 18 | Carl Icahn | 20.3 |
| 9 | S. Robson Walton | 33.3 | 19 | George Soros | 20 |
| 10 | Michael Bloomberg | 31 | 20 | Mark Zuckerberg | 19 |
Solution
First, we randomly select a whole number between 1 and k=4. Suppose we select 2. Thus, our systematic sample will consist of every 4th person in Table 9, starting with the 2nd person. That is, our systematic sample will consist of the 2nd, 6th, 10th, 14th, and 18th persons, shown here:
Systematic sample: Warren Buffett, Christy Walton, Michael Bloomberg, Sergey Brin, Carl Icahn.
NOW YOU CAN DO
Exercises 11–14.
YOUR TURN#8
- Generate a systematic sample with k=3, selecting every 3rd person, starting from Bill Gates.
- Obtain a systematic sample with k=5, selecting every 5th person, starting with Larry Ellison.
(The solutions are shown in Appendix A.)
Stratified Sampling
Often, researchers are interested in investigating characteristics of a certain subgroup of a population, such as 19- to 22-year-olds in Walnut, California. In cases like this, the researcher divides the population into subgroups, or strata, according to some characteristic, such as race or gender. Then a random sample is taken from each stratum. In this way, the researcher knows that a sample will be obtained from each stratum and that it will be large enough to provide reliable statistical inference for each stratum.
EXAMPLE 14 Stratified sampling

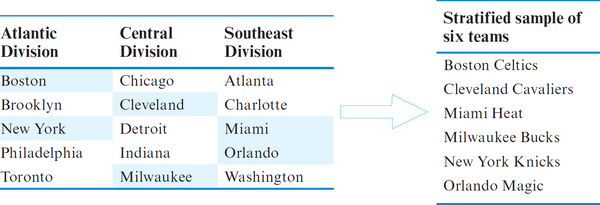
A researcher is interested in analyzing whether differences in scoring exist among the basketball teams in the three divisions of the Eastern Conference of the National Basketball Association (Table 10). Obtain a stratified sample of two teams from each division.
| Atlantic Division | Central Division | Southeast Division |
|---|---|---|
| Boston Celtics | Chicago Bulls | Atlanta Hawks |
| Brooklyn Nets | Cleveland Cavaliers | Charlotte Bobcats |
| New York Knicks | Detroit Pistons | Miami Heat |
| Philadelphia 76ers | Indiana Pacers | Orlando Magic |
| Toronto Raptors | Milwaukee Bucks | Washington Wizards |
Solution
A random sample of size two was drawn from the teams in each of the three divisions. These six teams are then combined to form our stratified sample of basketball teams. Note that each random sample is different, as yours will be.
NOW YOU CAN DO
Exercises 15–18.
Cluster Sampling
Cluster sampling is used when the population is widely scattered geographically or poses other logistical difficulties. For example, if we were interested in estimating the mean income of Manhattan residents, it would be time-consuming and expensive to visit 1000 different locations in Manhattan to elicit sample information. In cluster sampling, the population is divided into clusters, such as precincts or city blocks. Then several clusters are chosen at random, and all of the elements within the chosen clusters are selected for the sample. One disadvantage of cluster sampling is that the respondents from within a certain cluster will tend to be more similar to each other than the elements of a random sample would be. For example, if one of the clusters in the Manhattan income survey was a Fifth Avenue block, the mean income of residents there would be at the higher end of the income scale.
EXAMPLE 15 Cluster sampling
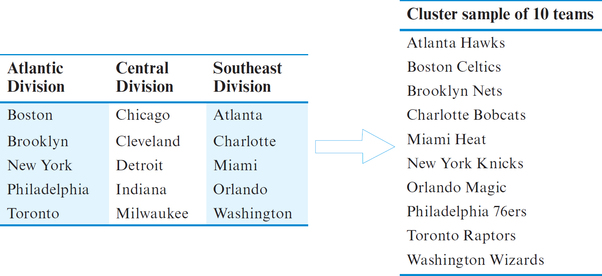
Using Table 10, consider each division to be a cluster. Construct a cluster sample of the teams in the Eastern Conference by randomly selecting two of the three clusters (divisions).
Solution
Suppose that we randomly select our clusters to be the Atlantic Division and the Southeast Division. Our cluster sample then consists of all the teams in both of these divisions, as follows:
NOW YOU CAN DO
Exercises 19 and 20.
Developing Your Statistical Sense
Stratified Sampling versus Cluster Sampling
Stratified sampling and cluster sampling are sometimes confused. To obtain a stratified sample, we (a) divide the population into subgroups (strata, the divisions in Table 10), and (b) take a random sample from each subgroup, as shown by the shaded teams in Example 14. In cluster sampling, we (a) divide the population into subgroups (the divisions in Table 10, this time called clusters), (b) take a random sample of the clusters, as shown by the shaded divisions in Example 15, and (c) choose all the elements in the selected clusters for our cluster sample. In stratified sampling, we are randomly selecting elements from the subgroups; in cluster sampling, we are randomly selecting the clusters only, not the elements in the clusters.
Convenience Sampling
In convenience sampling, subjects are chosen based on what is convenient for the survey personnel. If you were to estimate the true proportion of females taking an introductory statistics course using only the people in your class, this would be considered a convenience sample. As we shall see in Example 16, convenience sampling usually does not result in a representative sample.
EXAMPLE 16 Convenience sampling using online polls
 Caution: Surveys, like online polls, that use convenience sampling should be treated with a healthy dose of skepticism. They are not statistically sound.
An online newspaper reports that, in an online poll of its readership, 60% say that they get most of their news from online sources. Does this number accurately reflect the proportion of all Americans who get most of their news from online sources?
Solution
No, the sample is not random. Only those Americans who are online already (and already using an online news source) can respond to this online poll. Therefore, the sample is not random, and it is biased. It overestimates the proportion of Americans who get their news from online sources. Further, no mechanism is available to guard against a single person responding repeatedly and getting his or her vote counted multiple times. Online polls are not scientific, and their results should not be considered a true reflection of the sentiments of all Americans.
NOW YOU CAN DO
Exercises 21 and 22.
YOUR TURN#9
State whether the following scenarios represent convenience sampling.
- You need to conduct a survey for sociology class. You generate a random sample of five students at your school.
- You need to conduct a survey for sociology class. You obtain data from your five closest friends at school.
(The solutions are shown in Appendix A.)
EXAMPLE 17 Recognizing the sampling method
For each of the following, identify which type of sampling is represented.
- Students in your class are divided into females and males. A random sample of size 5 is then drawn from each of the groups.
- You are interested in estimating the average number of hours dormitory residents spend studying. In each dormitory, one floor is chosen at random and all the students on that floor are interviewed.
- You are researching the proportion of college students who prefer country music to other forms of music. You obtain a listing of all the students at your college and contact every 20th student on the list.
- Your campus statistical consulting center uses random digit dialing to locate potential subjects for a political survey.
- A student is investigating the prevalence of flu on campus this semester, and he asks 20 of his friends whether they have had the flu.
Solution
- Stratified sampling: (a) the population was divided into subgroups (females and males), and (b) a random sample was drawn from each of the groups.
- Cluster sampling: (a) the population was divided into clusters (dormitory floors), (b) a random sample of the clusters (floors) is taken, and (c) all students on that floor (cluster) were selected.
- Systematic sampling: where every kth member of the population is taken, with k=20.
- An example of random sampling, as illustrated on page 21.
- Convenience sampling: the student is choosing a sample convenient for him.
NOW YOU CAN DO
Exercises 23–26.
YOUR TURN#10
For each of the following, identify which type of sampling is represented.
- You are collecting data for a business project, and you ask five of your friends for their responses to the survey.
- Your campus meal services company asks every 10th student for his or her opinion on a new menu item.
- The school would like to determine student attitudes toward online learning. One class is chosen at random, and every student in the class is surveyed.
- Your professor wants to start a new nursing course. He divides students into two groups—nursing majors and all others—and then takes a random sample of 10 students from each group.
- Your professor wants help writing problems on the board, and he pulls two names out of a hat.
(The solutions are shown in Appendix A.)
3 Selection Bias and Questionnaire Design
Here, we learn about some common pitfalls in the design and implementation of a survey, including selection bias and the wording of a questionnaire.
The target population is the complete collection of all elements that we are interested in studying.
The potential population is the collection of elements from the target population that had a chance of being sampled.
Selection bias occurs when the potential population from which the actual sample is drawn is not representative of the target population, due to an inappropriate sampling method.
EXAMPLE 18 Selection bias
Suppose Ashley would like to estimate the proportion of American voters who would favor abandoning the present system of Social Security in favor of a system where retirement funds would be invested in the stock market. Ashley goes to the mall with her clipboard and canvasses as many people as she can on Monday between 9 A.M. and 5 P.M. To each person, she asked the question “Do you favor or oppose abandoning the present Social Security system in favor of a system that invests retirement funds in the stock market?”
- Identify Ashley's target population.
- Identify Ashley's potential population.
- Discuss any possible problems.
Solution
- Ashley's target population is the population of all American voters.
- The collection of all the American voters who visited the mall on Monday between 9 A.M. and 5 P.M. represent her potential population.
- It appears that Ashley's survey may suffer from selection bias. The population of people who went to the mall on Monday between 9 A.M. and 5 P.M. is not representative of the target population of all American voters. Because many American voters work on Mondays between 9 A.M. and 5 P.M., they are not elements of the potential population. Further, the proportion of retirees at the mall during that time was likely larger than in the target population of all American voters. These retirees tend to oppose strongly any potential changes to the Social Security system and would probably tend to respond in the negative to the survey question.
NOW YOU CAN DO
Exercises 27–30.
Five Factors for Good Questionnaire Design
You may have heard of the aphorism “Be careful what you ask for; you may get it.” This warning is certainly relevant to the issue of questionnaire design. The wording of questions can greatly affect the responses. Here are several factors to consider when designing a questionnaire.
- Remember: simplicity and clarity. Do not use four-syllable words when one-syllable words will do. Respondents will be shy about asking you to clarify the question. The result will be confused responses and muddled data.
- When reporting results, include the actual question asked. Be careful about drawing generalizations. The conclusions you draw may not have been what your respondents had in mind when they answered the questions.
- Avoid leading questions. The respondent is often eager to please and will try to tell you what he or she thinks you want to hear. For example, a researcher is interested in determining the proportion of Americans who favor preserving the welfare system. A leading question would be “A child growing up poor in America faces more than his fair share of crime and negligence. Do you support preserving the welfare safety net to help ensure that children are given a fair chance?”
- Avoid asking two questions in one. Avoid questions such as “Have you argued with your friends or family in the last month?” This is really two questions in one, and you will not know which question the respondents are answering.
- Avoid vague terminology. Words mean different things to different people. Avoid using terminology like “often” or “sometimes.” Instead, try to use specific terms such as “three times a week.” If you use ambiguous terms, the data you collect will be ambiguous, and any conclusions you draw will probably not be valid.
EXAMPLE 19 Questionnaire design
For each of the following questionnaire items, identify which of the five factors for good questionnaire design is violated, if any.
- Do you oppose the wasteful spending on foreign aid when so many problems confront us here at home?
- Do you often feel lonely?
- Do you espouse or disavow the conglomerative confluence of macroeconomic indicators?
- Have you watched television or downloaded music in the past 24 hours?
- Do you ever use a cell phone to access the Internet?
Solution
- This is a leading question, which is clearly trying to influence the respondent's answer.
- What is meant by “often”? Three times a week? Three times a day? This is vague terminology.
- This question would only be understood by those who have studied economics, and is neither simple nor clear.
- This is asking two questions in one. It is possible that respondents have done one or the other, or both.
- This question is fine. In fact, it is an actual survey question from the Pew Research Center.
NOW YOU CAN DO
Exercises 31–34.
4 Experimental Studies and Observational Studies
Two major types of statistical studies are experimental studies and observational studies. We have seen that researchers can gather data by consulting existing sources, by distributing a questionnaire, or by taking a sample. However, you may not be able to obtain the information you require by using survey or sampling methods. In this case, you may prefer to conduct an experimental study.
Note: What is the difference between an element and a subject? Subject is a term usually reserved for statistical studies, whereas the term element can be used for any data set.
Note: In some experiments, especially in medicine, members of the control group receive a placebo, a nonfunctioning simulated treatment. Sometimes, the symptoms of the members of the control group improve simply by taking the placebo, a phenomenon known as the placebo effect.
Experimental Studies
In an experimental study, researchers investigate how varying the predictor variable affects the response variable.
A predictor variable (also called an explanatory variable) is a characteristic intended to explain differences in the response variable.
A predictor variable that takes the form of a purposeful intervention is called a treatment.
A response variable is an outcome, a characteristic of the subjects of the experiment presumably brought about by differences in the predictor variable or treatment.
The subjects in a statistical study represent the elements from which the data are drawn.
A control is used as a standard of comparison for checking the results of the experiment. The treatment is calibrated against the control. Without the control, the treatment results cannot be compared.
We illustrate experimental studies using the following example.
EXAMPLE 20 Newborn babies and a heartbeat: An experimental study

A psychologist wanted to test whether the sound of a human heartbeat would help newborn babies grow. A baby nursery at a hospital was set up so that the sound of a human heartbeat could be heard throughout the nursery. The heartbeat sound was played in the nursery for a large batch of newborn children, who were then weighed to determine their weight gain after four days in the nursery. Later, a second batch of children occupied the nursery, but no heartbeat sound was played. These children were also weighed after four days in the nursery. Babies were randomly placed into the two groups. Identify the following:
- The subjects
- The predictor variable
- The treatment
- The response variable
- The control
Solution
- The babies were the subjects of this experimental study.
- The predictor variable is whether or not the heartbeat sound was played in the nursery.
- The treatment is the sound of the human heartbeat.
- The response variable is the baby's weight gain, which is the outcome of the study.
- The control is the group of babies for whom the heartbeat sound was not played.
The results were consistent with the psychologist's conjecture; the babies who listened to the heartbeat sound had a greater average weight gain than the babies for whom no heartbeat sound was played.
NOW YOU CAN DO
Exercises 35–46.
Two additional factors should be considered when designing an experimental study: randomization and replication.
Randomization. Many biases can be introduced into an experiment. For example, a well-meaning doctor may want to place underweight high-risk babies in the group with the heartbeat, in the hope that such babies will flourish. To eliminate biases like these, the placement of the subjects into the treatment and control groups should be done randomly.
Replication. One major theme of statistical investigation is that larger samples are usually better, because they allow more precise inference. In a statistical study, the treatment and the control groups each must contain a large enough number of subjects to allow detection of meaningful differences between the treatment and control. For example, if a researcher examined only three babies with the heartbeat sound and three babies without the heartbeat sound, this would not be a sufficient number of replications. In Chapter 8, “Confidence Intervals,” we will learn how large a sample size is sufficient for the needs of a particular study.
EXAMPLE 21 Randomization and replication
For each of the following scenarios, indicate (a) whether randomization is present, and (b) whether sufficient replication has been made.
- An experiment is conducted to determine if a certain type of genetically engineered corn seed will outproduce traditional corn seed. Fifty rows of Farmer Brown's field are sown with the genetically engineered corn seed and 50 rows of Farmer Grey's field are sown with the traditional seed.
- An experiment is conducted to see whether a new diabetes treatment will outperform a traditional treatment. Two mice each are randomly assigned to each of the treatment and control groups.
Solution
- The 50-row sample is probably enough replication. However, randomization is lacking. Perhaps Farmer Brown is a better farmer than Farmer Grey, in which case, this lurking variable or confounding variable will confound the results.
- Here, the randomization is fine, but two mice each is probably insufficient replication to uncover any strong statistical results.
NOW YOU CAN DO
Exercises 47 and 48.
Observational Studies
Circumstances exist where it could be impossible, impractical, or unethical for the researcher to place subjects into treatment and control groups. For example, suppose we are interested in whether women who work outside the home suffer less depression than women who remain at home with the children. The explanatory variable here is whether or not a woman works outside the home. However, it is not possible for the researcher to take women and randomly separate them into groups that either work outside the home or do not work outside the home.
Sometimes an experimental study is not possible for ethical reasons. Suppose you are interested in whether babies born to chemically dependent mothers display differences in cognitive skills from babies born to mothers who are not chemically dependent. It is clearly not ethical to randomly assign half of the mothers in the study to become chemically dependent during their pregnancy. Therefore, researchers need another type of statistical study: the observational study. In an observational study, the researcher observes whether the subjects' differences in the predictor variable are associated with differences in the response variable. No attempt is made to create differences in the predictor variable.
A sample survey is an example of an observational study. Data about a response variable may be obtained through the survey, along with information about possible predictor variables. No attempt is made to manipulate the variables. The researcher analyzes the information to determine whether differences in the predictor variable are associated with differences in the response variable.
EXAMPLE 22 Experiment or observational study
Examine the following scenarios, and state whether each represents an experiment or an observational study.
- A total of 50 female tobacco smokers and 50 female non-tobacco smokers are chosen. Lung capacity of the women is compared.
- A total of 100 asthma sufferers are randomly assigned to receive either a new treatment or a control. Asthma relief is measured.
Solution
- It would be unethical to assign a woman to smoke tobacco as part of an experiment. Therefore, scientists need to use observational studies, as this one is.
- The subjects were randomized into the treatment and control groups, making this an experiment.
NOW YOU CAN DO
Exercises 49 and 50.