Section 3.4 Exercises
CLARIFYING THE CONCEPTS
Question 3.256
1. What does it mean for a z-score to be positive? Negative? Zero? (p. 155)
3.4.1
Positive z−score: the data value is above the mean. Negative z−score: the data value is below the mean. z−score of zero: the data value is equal to the mean.
Question 3.257
2. Explain in your own words what the 95th percentile of a data set means. (p. 160)
Question 3.258
3. Why doesn't it make sense for there to be a 120th percentile of a data set? (p. 159)
3.4.3
No more than 100% of the data values can be less than or equal to any value in the data set.
Question 3.259
4. Is it possible for the 1st percentile of a data set to equal the 99th percentile? Explain when this would happen. (p. 159)
Question 3.260
5. Explain the difference between a percentile and a percentile rank. (p. 161)
3.4.5
A percentile is a data value while a percentile rank is a percentage.
Question 3.261
6. True or false: The IQR is sensitive to the presence of outliers. (p. 165)
PRACTICING THE TECHNIQUES
 CHECK IT OUT!
| To do | Check out | Topic |
|---|---|---|
| Exercises 7–18 | Example 21 | Calculate z-score, given data |
| Exercises 19–30 | Example 22 | Find data value, given z-score |
| Exercises 31–32 | Example 23 | Use z-scores to compare different data sets |
| Exercises 33–44 | Example 24 | Identify outliers using z-scores |
| Exercises 45–56 | Example 26 | Percentiles |
| Exercises 57–68 | Example 27 | Percentile rank |
| Exercises 69–76 | Example 28 | Quartiles |
| Exercises 77–78 | Example 30 | Interquartile range |
Use the following information for Exercises 7–10. Facebook reports that the average number of friends per Facebook user is 130. Assume the standard deviation is 30. Calculate the z-score for the indicated number of Facebook friends.
Question 3.262
7. 190 Facebook friends
3.4.7
2
Question 3.263
8. 145 Facebook friends
Question 3.264
9. 100 Facebook friends
3.4.9
–1.0
Question 3.265
10. Zero Facebook friends
For Exercises 11–14, use the following information. Social Strand Media reports that the mean amount of video uploaded to YouTube every minute by users around the world is 100 hours. Assume the standard deviation is 25 hours. Calculate the z-score for the indicated number of hours of video uploaded to YouTube.
Question 3.266
11. 125 hours
3.4.11
1
Question 3.267
12. 50 hours
Question 3.268
13. 200 hours
3.4.13
4
Question 3.269
14. 87.5 hours
Use the following information for Exercises 15–18. Suppose the mean blood sugar level is 100 mg/dl (milligrams per deciliter), with a standard deviation of 10 mg/dl.
Question 3.270
15. Alyssa has a blood sugar level of 90 mg/dl. How many standard deviations is Alyssa's blood sugar level below the mean?
3.4.15
1
Question 3.271
16. Benjamin has a blood sugar level of 135 mg/dl. How many standard deviations is Benjamin's blood sugar level above the mean?
Question 3.272
17. Chelsea has a blood sugar level of 125 mg/dl.
- If we calculate Chelsea's z-score, what is the scale?
- Calculate Chelsea's z-score.
- Interpret her z-score.
3.4.17
(a) The standard deviation, which is 10 mg/dl. (b) 2.5 (c) Chelsea's blood sugar level lies 2.5 standard deviations above the mean blood sugar level of 100 mg/dl.
Question 3.273
18. David has a blood sugar level of 85 mg/dl.
- Calculate David's z-score.
- Interpret his z-score.
For Exercises 19–22, use the following information. Facebook reports that the average number of friends per Facebook user is 130. Assume the standard deviation is 30. Find the number of Facebook friends represented by the following z-scores.
Question 3.274
19. z-score=−1.0
3.4.19
100
Question 3.275
20. z-score=−1.5
Question 3.276
21. z-score=0.0
3.4.21
130
Question 3.277
22. z-score=−3.5
Use the following information for Exercises 23–26. Social Strand Media reports that the mean amount of video uploaded to YouTube every minute by users around the world is 100 hours. Assume the standard deviation is 25 hours. Find the number of hours of YouTube video uploaded per minute for the following z-scores.
Question 3.278
23. z-score=2.0
3.4.23
150
Question 3.279
24. z-score=−2.0
Question 3.280
25. z-score=−0.5
3.4.25
87.5
Question 3.281
26. z-score=0.0
Use the following information for Exercises 27–30. Suppose the mean blood sugar level is 100 mg/dl (milligrams per deciliter), with a standard deviation of 10 mg/dl. Find the blood sugar levels associated with the following z-scores.
Question 3.282
27. z-score=1.96
3.4.27
119.6
Question 3.283
28. z-score=−2.576
Question 3.284
29. z-score=−1.96
3.4.29
80.4
Question 3.285
30. z-score=2.576
Question 3.286
31. Elizabeth's statistics class had a mean quiz score of 70 with a standard deviation of 15. Fiona's statistics class had a mean quiz score of 75 with a standard deviation of 5. Both Elizabeth and Fiona got an 85 on the quiz. Who did better relative to her class?
3.4.31
Elizabeth: z=1; Fiona: z=2; Fiona did better.
Question 3.287
32. Juan's business class had a mean quiz score of 60 with a standard deviation of 15. Luis's business class had a mean quiz score of 70 with a standard deviation of 5. Both Juan and Luis got a 75 on the quiz. Who did better relative to his class?
For Exercises 33–44, determine whether the data value represents an outlier, using the z-score method.
Question 3.288
33. The 190 Facebook friends from Exercise 7
3.4.33
Moderately unusual
Question 3.289
34. The 145 Facebook friends from Exercise 8
Question 3.290
35. The 100 Facebook friends from Exercise 9.
3.4.35
Not unusual
Question 3.291
36. The zero Facebook friends from Exercise 10.
Question 3.292
37. The 125 hours of YouTube video from Exercise 11.
3.4.37
Not unusual
Question 3.293
38. The 50 hours of YouTube video from Exercise 12.
Question 3.294
39. The 200 hours of YouTube video from Exercise 13.
3.4.39
Outlier
Question 3.295
40. The 87.5 hours of YouTube video from Exercise 14.
Question 3.296
41. Alyssa's blood sugar level from Exercise 15.
3.4.41
Not unusual
Question 3.297
42. Benjamin's blood sugar level from Exercise 16.
Question 3.298
43. Chelsea's blood sugar level from Exercise 17.
3.4.43
Moderately unusual
Question 3.299
44. David's blood sugar level from Exercise 18.
Use the following data for Exercises 45–50. The variable is Highway MPG, which is the number of miles a vehicle can travel on a highway on one gallon of gas. The sample is taken from the Chapter 8 Case Study, Motor Vehicle Fuel Efficiency. Find the highway MPG represented by the indicated percentiles.
| Vehicle | Highway MPG |
Vehicle | Highway MPG |
|---|---|---|---|
| Honda CR-V | 30 | Subaru Impreza | 25 |
| Nissan Pathfinder | 26 | Ford Mustang | 26 |
| Chevrolet Chevy SS |
21 | Cadillac ATS | 31 |
| Dodge Charger | 27 | Chevrolet Camaro | 24 |
| Jeep Compass | 23 | Ford Taurus | 29 |
| Lincoln MKT | 25 | Ford Expedition | 20 |
Question 3.300
45. 75th
3.4.45
28
Question 3.301
46. 5th
Question 3.302
47. 95th
3.4.47
31
Question 3.303
48. 90th
Question 3.304
49. 10th
3.4.49
21
Question 3.305
50. 99th
Use the following data for Exercises 51–56. Research has shown that the amount of sodium consumed in food has been associated with hypertension (high blood pressure). The table provides a list of 16 breakfast cereals, along with their sodium content, in milligrams per serving. Find the amount of sodium represented by the indicated percentiles.
| Cereal | Sodium | Cereal | Sodium |
|---|---|---|---|
| Apple Jacks | 125 | Grape Nuts Flakes | 140 |
| Cap'n Crunch | 220 | Kix | 260 |
| Cinnamon Toast Crunch |
210 | Life | 150 |
| Corn Flakes | 290 | Lucky Charms | 180 |
| Count Chocula | 180 | Raisin Bran | 210 |
| Cream of Wheat | 80 | Rice Chex | 240 |
| Fruit Loops | 125 | Special K | 230 |
| Fruity Pebbles | 135 | Total Whole Grain | 200 |
Question 3.306
cereals
51. 75th
3.4.51
225
Question 3.307
cereals
52. 10th
Question 3.308
cereals
53. 90th
3.4.53
260
Question 3.309
cereals
54. 30th
Question 3.310
cereals
55. 5th
3.4.55
80
Question 3.311
cereals
56. 95th
Using the highway MPG data above, calculate the percentile rank for the indicated highway MPG in Exercises 57–62.
Question 3.312
57. 30
3.4.57
92nd percentile
Question 3.313
58. 31
Question 3.314
59. 20
3.4.59
8th percentile
Question 3.315
60. 25
Question 3.316
61. 27
3.4.61
75th percentile
Question 3.317
62. 29
Use the cereal sodium data above to calculate the percentile rank for the indicated amount of sodium (in mg) in Exercises 63–68.
Question 3.318
63. 80
3.4.63
6th percentile
Question 3.319
64. 290
Question 3.320
65. 260
3.4.65
94th percentile
Question 3.321
66. 125
Question 3.322
67. 230
3.4.67
81st percentile
Question 3.323
68. 220
Use the highway MPG data above for Exercises 69–72.
Question 3.324
69. Find Q1, the first quartile.
3.4.69
23.5
Question 3.325
70. Calculate Q2, the second quartile.
Question 3.326
71. Compute Q3, the third quartile.
3.4.71
28
Question 3.327
72. Find the median, and compare it to Q2.
For Exercises 73–76, use the cereal sodium data above.
Question 3.328
73. Find Q1, the first quartile.
3.4.73
137.5
Question 3.329
74. Calculate Q2, the second quartile.
Question 3.330
75. Compute Q3, the third quartile.
3.4.75
225
Question 3.331
76. Find the median, and compare it to Q2.
Question 3.332
77. Use your work in Exercises 69 and 71 to compute the IQR for the highway MPG data. What does this number mean?
3.4.77
4.5. The middle 50%, or middle half, of the highway MPG data ranged over 4.5 miles per gallon.
Question 3.333
78. Use your work in Exercises 73 and 75 to compute the IQR for the cereal sodium data. What does this number mean?
APPLYING THE CONCEPTS
Breakfast Calories. Refer to Table 23 for Exercises 79–86.
| Cereal | Calories |
|---|---|
| Apple Jacks | 110 |
| Basic 4 | 130 |
| Bran Chex | 90 |
| Bran Flakes | 90 |
| Cap'n Crunch | 120 |
| Cheerios | 110 |
| Cinnamon Toast Crunch | 120 |
| Cocoa Puffs | 110 |
| Corn Chex | 110 |
| Corn Flakes | 100 |
| Corn Pops | 110 |
| Count Chocula | 110 |
Question 3.334
breakfastcal
79. Find the z-scores for the calories for the following cereals:
- Corn Flakes
- Basic 4
- Bran Flakes
- Cap'n Crunch
3.4.79
(a) −0.79 (b) 1.79 (c) −1.65 (d) 0.93
Question 3.335
breakfastcal
80. Find the number of calories associated with the following z-scores:
- 0
- 1
- −1
- 0.5
Question 3.336
breakfastcal
81. Determine whether any of the cereals is an outlier.
3.4.81
No outliers
Question 3.337
breakfastcal
82. Find the following percentiles:
- 25th
- 50th
- 75th
- 95th
Question 3.338
breakfastcal
83. Find the percentile rank for each of the following:
- 90 calories
- 120 calories
- 110 calories
- 100 calories
3.4.83
(a) 17% (b) 92% (c) 75% (d) 25%
Question 3.339
breakfastcal
84. Find the following:
- Q1
- Q2
- Q3
- IQR
Question 3.340
breakfastcal
85. Explain what the IQR value from Exercise 84 (d) means.
3.4.85
The middle 50%, or half, of the number of calories in 12 breakfast cereals ranges over 10 calories.
Question 3.341
breakfastcal
86. Suppose that a weight-control organization recommended eating breakfast cereals with the lowest 10% of calories.
- How many calories does this cutoff represent?
- Which cereals are recommended?
Dietary Supplements. Refer to Table 24 for Exercises 87–94. The table gives the number of American adults who have used the indicated “nonvitamin, nonmineral, natural products.”
| Product | Usage (in millions) |
Product | Usage (in millions) |
|---|---|---|---|
| Echinacea | 14.7 | Ginger | 3.8 |
| Ginseng | 8.8 | Soy | 3.5 |
| Ginkgo biloba | 7.7 | Chamomile | 3.1 |
| Garlic | 7.1 | Bee pollen | 2.8 |
| Glucosamine | 5.2 | Kava kava | 2.4 |
| St. John's wort | 4.4 | Valerian | 2.1 |
| Peppermint | 4.3 | Saw palmetto | 2.0 |
| Fish oil | 4.2 |
Question 3.342
dietarysupp
87. Find the z-scores for usage of the following products:
- Echinacea
- Saw palmetto
- Valerian
- Ginseng
3.4.87
(a) 2.87 (b) −0.91 (c) −0.89 (d) 1.11
Question 3.343
dietarysupp
88. Find the usage associated with each of the following z-scores.
- 0
- 3
- −3
- 1
Question 3.344
dietarysupp
89. Identify any outliers in the data set.
3.4.89
Echinacea with 14.7 million users is moderately unusual.
Question 3.345
dietarysupp
90. Find the following percentiles:
- 10th
- 90th
- 5th
- 95th
Question 3.346
dietarysupp
91. Find the percentile rank for each of the following usages:
- 14.7 million
- 2.0 million
- 8.8 million
- 2.1 million
3.4.91
(a) 100% (b) 7% (c) 93% (d) 13%
Question 3.347
dietarysupp
92. Find the following:
- Q1
- Q2
- Q3
- IQR
Question 3.348
dietarysupp
93. Interpret the IQR value from Exercise 92 (d) so that a nonspecialist could understand it.
3.4.93
The middle 50%, or half, of the usage of dietary supplements ranges over 4.3 million.
Question 3.349
dietarysupp
94. Suppose an advertising agency is interested in the top 15% of supplements.
- What usage does this represent?
- Which supplements would be of interest?
Question 3.350
95. Expenditure per Pupil. The 5th percentile expenditure per pupil nationwide in 2005 was $6,381, the 50th percentile was $8,998, and the 95th percentile was $17,188.5
- Determine whether the distribution of expenditures is symmetric, left-skewed, or right-skewed.
- Would we expect the mean expenditure per pupil to be less than, equal to, or greater than $8,998? Explain.
- Draw a distribution curve that matches this information.
3.4.95
(a) Right-skewed (b) Greater than, since the distribution is right-skewed. (c) Answers will vary.
For Exercises 96–99, consider whether the scenarios are possible. If it is possible, then clearly describe what the data set would look like. If it is not possible, explain why.
Question 3.351
96. A scenario where the first and second quartiles of a data set are equal
Question 3.352
97. A scenario where the mean of a data set is larger than Q3
3.4.97
Right-skewed with a few values much larger than the rest; median line of box plot closer to the line for Q3 than the line for Q1.
Question 3.353
98. A scenario where the median of a data set is smaller than Q1
Question 3.354
99. A scenario where the IQR is negative
3.4.99
Not possible. Q1, the 25th percentile, will always be less than or equal to Q3, the 75th percentile. Thus the IQR = Q3 – Q1 is always greater than or equal to zero.
Twitter Followers. Are you on Twitter? How many Twitter followers do you have? Jon Bruner from O'Reilly Media reported6 the information in Table 25. For selected percentiles, Table 25 shows the number of Twitter followers that each percentile represents. For example, the 50th percentile is 61 Twitter followers. Use Table 25 for Exercises 100–105. Twitter reports that there are 400 million active Twitter users worldwide who actually tweet (post messages).
Question 3.355
100. What percent of Twitter accounts have three or fewer followers?
Question 3.356
101. What percent of Twitter accounts have between three and 19 followers?
3.4.101
20%
Question 3.357
102. How many active Twitter users have between 2,991 and 24,964 followers?
Question 3.358
103. How many active Twitter users have more than 24,964 followers?
3.4.103
0.1%
Question 3.359
104. Is it possible using Table 25 to find what percent of Twitter accounts have 100 or fewer followers? How might we estimate it?
Question 3.360
twitterpercentile
105. What is the percentile rank of 819 Twitter followers?
| Percentile | Number of Twitter followers |
|---|---|
| 10 | 3 |
| 20 | 9 |
| 30 | 19 |
| 40 | 36 |
| 50 | 61 |
| 60 | 98 |
| 70 | 154 |
| 80 | 246 |
| 90 | 458 |
| 95 | 819 |
| 99 | 2,991 |
| 99.9 | 24,964 |
3.4.105
95th percentile
WORKING WITH LARGE DATA SETS
 Financial Experts versus the Darts. This set of exercises examines measures of relative position using the Darts data set from the Chapter 3 Case Study. Open the Darts data set. Use technology to do Exercises 106–112.
Question 3.361
darts
106. Find the median for each of the professionals, the Darts, and the DJIA. To those who would say that using darts is better, what do the relative values of the medians say?
Question 3.362
darts
107. Calculate the z-score for the median for each of the three groups. What does the sign of the z-score for each group indicate about the relationship between the median and the mean?
3.4.107
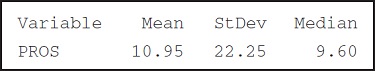
z=−0.607
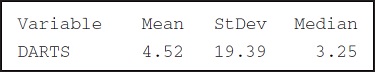
z−score=−0.655
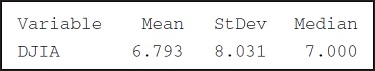
z−score=−0.258
For the pros and the darts data the median is below the mean. For the DJIA data the median is above the mean.
Question 3.363
darts
108. For each group, compute the stock price change represented by the following z-scores.
- 2
- −2
Question 3.364
darts
109. For each group, what percentage of the data lies between the values you found in the previous exercise?
3.4.109
About 95%
Question 3.365
darts
110. For each group, calculate the first quartile and the third quartile.
Question 3.366
darts
111. Calculate and interpret the IQR for each group.
3.4.111
Pros: IQR = 32.4
For the professionals, the middle 50%, or middle half, of the change in stocks data ranged over 32.4%.
Darts: IQR = 20.60
For using darts, the middle 50%, or middle half, of the change in stocks data ranged over 20.60%.
DJIA: IQR = 11.65
For the DJIA, the middle 50%, or middle half, of the change in stocks data ranged over 11.65%.
Question 3.367
darts
112. For each group, compare the IQR with the range and standard deviation. Do all these measures of spread agree regarding which group has the least variability? The most variability?
BRINGING IT ALL TOGETHER
Pedestrian Fatalities. The Department of Transportation releases statistics on the number of pedestrians killed by vehicles in the United States. The following table contains the pedestrian fatality rate (number of fatalities per 100,000 population) for 2013 for six states. Use this information for Exercises 113–120.
| State | Pedestrian fatality rate |
|---|---|
| Nebraska | 0.38 |
| Ohio | 0.90 |
| Tennessee | 1.25 |
| Texas | 1.64 |
| California | 1.66 |
| Florida | 2.57 |
Question 3.368
pedestrians
113. Find the z-scores for the pedestrian fatality rate for the following states:
- Ohio
- Texas
- Florida
3.4.113
(a) −0.6673 (b) 0.3203 (c) 1.5615
Question 3.369
pedestrians
114. Find the pedestrian fatality rates indicated by the following z-scores:
- −2
- 1
- 3
Question 3.370
pedestrians
115. Determine whether the pedestrian fatality rates for any of the states represents an outlier.
3.4.115
No outliers
Question 3.371
pedestrians
116. If the pedestrian fatality rate for Nebraska and Florida do not represent outliers, explain why we need not check whether the pedestrian fatality rates for the other states are outliers.
Question 3.372
pedestrians
117. Find the following percentiles:
- 50th
- 75th
- 25th
3.4.117
(a) 1.445 fatalities per 100,000 people (b) 1.66 fatalities per 100,000 people (c) 0.90 fatality per 100,000 people
Question 3.373
pedestrians
118. Calculate the percentile rank for the following pedestrian fatality rates:
- 0.38
- 1.25
- 2.57
Question 3.374
pedestrians
119. Find the following:
- Q1
- Q2
- Q3
- IQR
3.4.119
(a) 0.90 fatality per 100,000 people (b) 1.445 fatalities per 100,000 people (c) 1.66 fatalities per 100,000 people (d) 0.76 fatality per 100,000 people
Question 3.375
pedestrians
120. Interpret the IQR value from Exercise 119 (d).